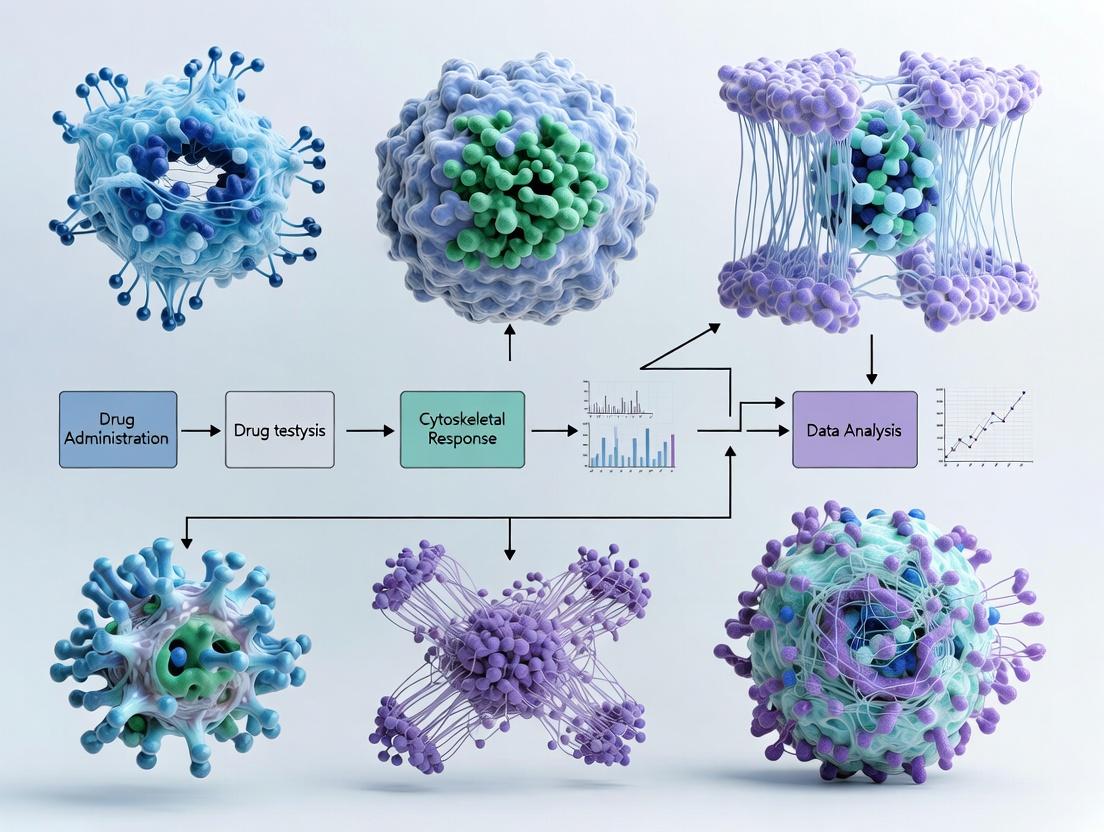
Revolutionizing Drug Discovery: Advanced 3D Cell Culture Models for Cytoskeletal-Targeting Therapeutics
This article provides a comprehensive guide for researchers and drug development professionals on utilizing 3D cell culture models for testing cytoskeletal-targeting drugs.
Revolutionizing Drug Discovery: Advanced 3D Cell Culture Models for Cytoskeletal-Targeting Therapeutics
Abstract
This article provides a comprehensive guide for researchers and drug development professionals on utilizing 3D cell culture models for testing cytoskeletal-targeting drugs. It explores the critical role of the cytoskeleton in disease and therapy, details the establishment and application of physiologically relevant 3D models (including spheroids, organoids, and bioprinted scaffolds), addresses common technical challenges, and validates these advanced systems against traditional 2D cultures and in vivo data. The scope covers foundational biology, practical methodologies, optimization strategies, and comparative analyses to enhance predictive accuracy in preclinical drug screening.
The Cytoskeleton in 3D: Why Architecture Matters for Drug Targeting
In 3D cell culture models for cytoskeletal drug testing, the cytoskeleton is a critical therapeutic target and a biomarker for phenotypic response. Unlike 2D monolayers, 3D architectures (e.g., spheroids, organoids) present unique cytoskeletal organization and mechanical properties that more accurately mimic in vivo physiology. This directly impacts drug efficacy, resistance mechanisms, and off-target effects. Research within this thesis framework utilizes 3D models to screen compounds targeting cytoskeletal dynamics, assessing not only cytotoxicity but also morphogenetic disruption, invasion potential, and mechanotransduction pathways.
Key Components: Structure, Proteins, and Quantitative Data
Table 1: Core Cytoskeletal Filaments: Composition and Properties
| Property | Actin Filaments (Microfilaments) | Microtubules | Intermediate Filaments |
|---|---|---|---|
| Diameter | ~7 nm | ~25 nm | ~10 nm |
| Monomer | G-actin (globular) | α/β-tubulin heterodimer | Protein-family specific (e.g., keratin, vimentin, lamin) |
| Polarity | Yes (barbed (+), pointed (-) ends) | Yes (plus (+), minus (-) ends) | No (non-polar) |
| Dynamic Instability | No (undergoes treadmilling) | Yes (growth/shrinkage cycles) | No (stable) |
| Nucleation Site | Arp2/3 complex, formins | γ-Tubulin Ring Complex (γ-TuRC) | No required nucleator; filament assembly is staggered |
| Primary Motor Proteins | Myosins | Dyneins, Kinesins | None |
| Key Regulatory Drugs (Examples) | Latrunculin A/B (depolymerizer), Phalloidin (stabilizer), Jasplakinolide (stabilizer) | Paclitaxel/Taxol (stabilizer), Colchicine, Nocodazole, Vinca alkaloids (depolymerizers) | Withaferin A (vimentin disruptor), Acrylamide (neurofilament disruptor) |
| Typical Tensile Strength | ~0.2 GPa (in bundle) | ~1-2 GPa (compressive strength) | ~0.2-0.5 GPa (high tensile strength) |
| Key Functions in 3D Models | Cell cortex tension, contractility, adhesion, invasion, morphogenesis | Mitotic spindle, intracellular transport, organelle positioning, 3D structural polarity | Mechanical integrity, nuclear lamina, stress resistance, tissue-specific integrity |
Core Functions in 3D Cell Culture and Drug Testing Context
- Structural Scaffolding & Mechanotransduction: Provides 3D shape resilience. In spheroids, IFs and cortical actin bear compressive stress. Drugs altering stiffness affect growth and signaling.
- Intracellular Transport & Logistics: Microtubules are highways for vesicle/organelle transport crucial for secretion and signaling gradients in 3D structures.
- Cell Motility & Invasion: Actin-driven protrusions (lamellipodia, filopodia) and actomyosin contractility are key targets for anti-metastatic drugs. 3D invasion assays depend on this.
- Cell Division: Microtubule-targeting agents (MTAs) are primary anti-mitotic chemotherapeutics. 3D models often show altered mitotic sensitivity.
- Signal Integration: The cytoskeleton acts as a spatial organizer for signaling molecules, affecting pathways like Hippo, Wnt, and YAP/TAZ in 3D.
Application Notes & Protocols for 3D Cytoskeletal Research
Application Note AN-3D-CSK-1: Quantifying Cytoskeletal Drug Response in Tumor Spheroids
Objective: To evaluate the efficacy and phenotypic impact of cytoskeletal-targeting drugs on pre-formed cancer spheroids. Background: 3D spheroids recapitulate tumor microenvironments, including gradients of nutrient, oxygen, and drug penetration, leading to differential cytoskeletal responses in core vs. periphery cells.
Protocol 1: High-Content Imaging and Analysis of Filament Architecture
- Spheroid Formation: Seed HT-29 colon carcinoma cells in U-bottom ultra-low attachment plates at 1000 cells/well. Centrifuge at 300 x g for 3 min. Incubate for 72h to form compact spheroids.
- Drug Treatment: Prepare serial dilutions of drugs (e.g., Paclitaxel, Latrunculin B) in complete medium. Gently add to spheroid wells. Include DMSO vehicle controls. Incubate for 24-48h.
- Fixation and Staining: Carefully aspirate medium. Fix with 4% paraformaldehyde (PFA) for 45 min at RT. Permeabilize with 0.5% Triton X-100 for 20 min. Block with 5% BSA for 1h.
- Triple-Label Stain:
- Actin: Phalloidin-Alexa Fluor 488 (1:200, 90 min).
- Microtubules: Anti-α-tubulin primary antibody (1:500, O/N at 4°C), then anti-mouse-Alexa Fluor 555 (1:1000, 90 min).
- Nuclei: Hoechst 33342 (1 µg/mL, 15 min).
- Triple-Label Stain:
- Imaging: Acquire z-stacks using a confocal or spinning-disk microscope with a 20x water immersion objective. Maintain consistent laser power and exposure across conditions.
- Quantitative Analysis (Use ImageJ/FIJI or commercial HCS software):
- Spheroid Size: Measure cross-sectional area from maximum intensity projection.
- Actin Intensity/Cortex Thickness: Measure mean phalloidin intensity at the spheroid periphery (5-pixel thick rim).
- Microtubule Organization: Apply a FibrilTool macro to quantify alignment/orientation disorder in the tubulin channel.
- Viability Core: Calculate the ratio of Hoechst intensity in the inner 50% of the spheroid vs. the outer 50% (core depletion indicates cell death).
Diagram Title: 3D Spheroid Cytoskeletal Drug Assay Workflow
Protocol 2: Invasion Assay in 3D Collagen Matrices via Actin Disruption
Objective: To assess the inhibitory effect of actin-targeting compounds on single-cell invasion from spheroids embedded in a collagen I matrix.
- Spheroid Preparation: Form uniform spheroids as in Protocol 1, step 1.
- Collagen Embedding: On ice, mix rat tail collagen I (final 2 mg/mL), 10x PBS, 0.1N NaOH for neutralization, and cell culture medium. Quickly add 50 µL drops to a 24-well plate. Place one spheroid per drop. Incubate at 37°C for 30 min to polymerize. Gently overlay with medium containing drug or vehicle.
- Live-Cell Imaging: Place plate in an environmentally controlled (37°C, 5% CO2) live-cell imager. Acquire phase-contrast/DIC images every 30 min for 24-48h at multiple positions.
- Analysis of Invasion:
- Track the distance from the original spheroid edge to the leading invading cell front over time.
- Calculate the Invasion Index: (Total area occupied by cells at T=24h / Initial spheroid area at T=0).
- Quantify the number of invasive protrusions per spheroid.
Diagram Title: Actin Disruption Inhibits 3D Invasion Pathway
The Scientist's Toolkit: Research Reagent Solutions
Table 2: Essential Materials for 3D Cytoskeletal Assays
| Reagent/Material | Function/Description | Example Product/Catalog |
|---|---|---|
| Ultra-Low Attachment (ULA) Plates | Promotes 3D spheroid formation by inhibiting cell adhesion. Crucial for consistent aggregate formation. | Corning Spheroid Microplates, Nunclon Sphera |
| Recombinant Collagen I, High Concentration | Major ECM component for 3D invasion assays. Provides physiological stiffness and ligand density. | Rat tail Collagen I, 8-10 mg/mL (e.g., Corning 354249) |
| Cytoskeletal-Targeting Small Molecules | Pharmacologic probes to disrupt or stabilize specific filaments. Core tools for perturbation studies. | Paclitaxel (Microtubule stabilizer), Nocodazole (Microtubule depolymerizer), Latrunculin A (Actin depolymerizer), CK-666 (Arp2/3 inhibitor) |
| Live-Cell Imaging-Optimized Dyes | Fluorescent probes for dynamic tracking of cytoskeletal elements with low cytotoxicity. | SiR-Actin, SiR-Tubulin (Cytoskeleton Inc.), SPY650-FastAct (for actin), CellLight BacMam constructs |
| High-Specificity Antibodies | For immunofluorescence of cytoskeletal components, especially for IFs which lack small-molecule dyes. | Anti-α-Tubulin (clone DM1A), Anti-Vimentin (clone D21H3), Anti-Keratin 8/18 (pan-cytokeratin) |
| Metabolically-Quiet Phenol Red-Free Medium | Essential for long-term live imaging to reduce background fluorescence and estrogenic effects. | FluoroBrite DMEM, Leibovitz's L-15 Medium |
| Automated Image Analysis Software | Enables high-throughput, unbiased quantification of complex 3D cytoskeletal phenotypes. | FIJI/ImageJ (with plugins: MorphoLibJ, FibrilTool), CellProfiler, Imaris (for 3D rendering), HCS Studio |
Traditional two-dimensional (2D) monolayer cell culture has been the cornerstone of in vitro drug discovery, including for compounds targeting the cytoskeleton (e.g., microtubule stabilizers/destabilizers, actin modulators). However, these models exhibit critical limitations that compromise their predictive validity for clinical outcomes. Within the broader thesis advocating for 3D cell culture models, this document delineates the specific shortcomings of 2D systems in cytoskeletal drug testing and provides protocols for comparative analysis.
Key Limitations of 2D Models:
- Altered Cell Morphology and Polarity: Cells in 2D adopt flattened, stretched morphologies with aberrant polarization, disrupting native cytoskeletal architecture and force transduction.
- Dysregulated Cell-Cell and Cell-ECM Interactions: The unnatural, homogeneous extracellular matrix (ECM) contact fails to recapitulate the biomechanical and biochemical signaling cues of 3D tissues, which are critical for cytoskeletal organization.
- Compromised Drug Penetration and Gradient Formation: 2D monolayers do not present the physical diffusion barriers found in 3D tissues (e.g., spheroids, organoids), leading to overestimation of compound efficacy and inaccurate pharmacokinetic profiles.
- Altered Gene Expression and Signaling: The non-physiological environment leads to significant differences in gene expression profiles related to cytoskeletal regulation, cell adhesion, and mechanotransduction pathways (e.g., Rho GTPase, YAP/TAZ signaling).
Quantitative Comparison of 2D vs. 3D Model Responses to Cytoskeletal Drugs Table 1: Compiled data from recent studies highlights differential drug responses.
| Parameter | 2D Monolayer Model | 3D Spheroid/Matrix Model | Implication for Drug Testing |
|---|---|---|---|
| IC50 for Paclitaxel | 2-10 nM | 20-100 nM (≥10-fold increase) | 2D systems significantly underestimate the drug concentration required for efficacy in tissue-like structures. |
| Apoptosis Induction | High, uniform | Heterogeneous, primarily in outer layers | 2D models overpredict cell death and fail to model survival in hypoxic/protected core regions. |
| Actin Organization | Stress fibers dominant | Cortical actin networks, 3D adhesions | Drug effects on actin are misrepresented, impacting assessment of compounds targeting metastasis/invasion. |
| Drug Penetration Rate | Instantaneous, uniform | Slow, gradient-dependent (core penetration: 50-200 µm/hr) | 2D models cannot inform on penetration kinetics, a critical failure point for many therapeutics. |
| YAP/TAZ Nuclear Localization | Constitutively high | Context-dependent, regulated by 3D spatial constraints | Misregulation of mechanosensing pathways in 2D leads to false positives/negatives for drugs affecting these pathways. |
Experimental Protocols
Protocol 1: Comparative Assessment of Cytoskeletal Drug Efficacy in 2D vs. 3D Spheroid Models
Objective: To evaluate the differential efficacy and mechanism of action of a microtubule-targeting agent (e.g., Paclitaxel) in 2D monolayers versus 3D spheroids.
Research Reagent Solutions & Materials: Table 2: Essential materials for the comparative assay.
| Item | Function |
|---|---|
| U-bottom Ultra-Low Attachment (ULA) Plate | Promotes spontaneous spheroid formation via forced aggregation. |
| Basement Membrane Extract (BME, e.g., Matrigel) | Provides a physiological 3D extracellular matrix for embedded culture. |
| Live-Cell Cytoskeletal Dye (e.g., SiR-actin/tubulin) | Allows for real-time, non-destructive visualization of cytoskeletal dynamics. |
| ATP-based Viability Assay Kit (3D-optimized) | Quantifies metabolically active cells within 3D structures, accounting for penetration limitations. |
| Confocal Microscope with Z-stack capability | Essential for imaging the interior of 3D spheroids. |
| Multicellular Tumor Spheroid (MCTS) Cell Line | e.g., HCT-116, U87-MG, which reliably form tight, reproducible spheroids. |
Methodology:
- 3D Spheroid Formation: Seed 1,000-5,000 cells/well in a 96-well ULA plate. Centrifuge at 300 x g for 3 minutes to aggregate cells. Incubate for 72-96 hours until compact spheroids form.
- 2D Monolayer Preparation: Seed cells at standard density (e.g., 5,000 cells/well) in a tissue culture-treated 96-well plate 24 hours prior to dosing.
- Drug Treatment: Prepare a 10-point serial dilution of Paclitaxel (e.g., 1 µM to 0.1 nM). Aspirate media from both models and add drug-containing media. For 3D spheroids, include a vehicle control in BME-embedded conditions.
- Viability Assessment (at 72h):
- 2D: Perform standard ATP-based luminescence assay.
- 3D: Use an ATP assay kit validated for 3D cultures. Include a lysis/equilibration step per manufacturer's instructions to ensure reagent penetration.
- Cytoskeletal Phenotyping (at 24h):
- Stain live spheroids and monolayers with 100 nM SiR-tubulin for 4 hours.
- For 3D spheroids, transfer to a glass-bottom dish for imaging. Acquire Z-stacks (20-30 µm depth) using a confocal microscope.
- Analyze images for microtubule bundling, cell rounding, and mitotic arrest. Note spatial heterogeneity in 3D spheroids.
- Data Analysis: Calculate IC50 values for both models using non-linear regression. Compare the fold-difference. Qualitatively and quantitatively assess differences in cytoskeletal morphology.
Protocol 2: Evaluating Drug Penetration and Gradient Effects
Objective: To visualize and quantify the penetration profile of a fluorescently-tagged cytoskeletal drug (e.g., BODIPY FL Paclitaxel) into 3D spheroids versus uniform distribution in 2D.
Methodology:
- Model Preparation: Generate spheroids (>500 µm diameter) and monolayers as in Protocol 1.
- Dosing and Incubation: Treat models with 100 nM BODIPY FL Paclitaxel for 2, 6, and 24 hours.
- Imaging and Quantification:
- Wash models gently with PBS.
- Immediately image using a confocal microscope. For spheroids, obtain a Z-stack through the center.
- Use image analysis software (e.g., ImageJ) to plot fluorescence intensity as a function of distance from the spheroid periphery to the core.
- Correlation with Effect: Co-stain with a viability marker (e.g., propidium iodide) at endpoint to correlate drug distribution zones with regions of cell death.
Signaling Pathway and Workflow Visualizations
This Application Note details methodologies for establishing 3D microenvironments that replicate tissue-specific mechanical and biochemical cues, a core component of a thesis focused on cytoskeletal drug testing. These models are critical for preclinical evaluation of compounds targeting the actin cytoskeleton, as stiffness and architecture profoundly influence cell contractility, adhesion, and drug response.
Table 1: Representative Matrix Stiffness and Composition for Tissue Recapitulation
| Tissue Type | Target Elastic Modulus (kPa) | Key ECM Components | Typical 3D Scaffold System |
|---|---|---|---|
| Brain | 0.1 - 1.0 | Laminin, Collagen IV | Soft fibrin, Hyaluronic acid gels |
| Breast (normal) | 0.1 - 0.5 | Collagen I, Laminin | Low-density collagen I gels |
| Breast (carcinoma) | 4.0 - 12.0 | Collagen I, Fibronectin | High-density collagen I, PEG-based gels |
| Skeletal Muscle | 12.0 - 20.0 | Collagen I, Fibrin, Matrigel | Fibrin gels, Aligned nanofiber scaffolds |
| Bone | > 30.0 (calcified) | Collagen I, Hydroxyapatite | Poly(ethylene glycol) diacrylate (PEGDA), Silk fibroin |
| Liver | 0.5 - 2.0 | Collagen I, III, IV | Collagen I gels, Decellularized ECM hydrogels |
Table 2: Key Signaling Pathways Modulated by 3D Microenvironment
| Pathway | Primary Mechanosensor | Key Downstream Effectors | Relevance to Cytoskeletal Drugs |
|---|---|---|---|
| YAP/TAZ | F-actin tension, LATS1/2 | TEAD transcription factors | Target for disrupting mechanotransduction in cancer |
| Rho/ROCK | Integrins, GEFs | ROCK, MYPT1, MLC2 | Direct target of ROCK inhibitors (e.g., Y-27632) |
| FAK-Src | Integrin clustering | Paxillin, ERK, PI3K | Altered in 3D vs. 2D; impacts adhesion survival |
| TGF-β | Integrin αvβ6/β8, stiffness | Smad2/3, Smad4 | Drives matrix production and epithelial-mesenchymal transition |
Experimental Protocols
Protocol 1: Fabrication of Tunable Stiffness Collagen I Hydrogels for Breast Tissue Modeling
Objective: To generate 3D collagen gels mimicking normal (0.5 kPa) and malignant (4-8 kPa) breast tissue stiffness for drug testing.
Materials:
- Rat tail Collagen I, high concentration (e.g., 8-10 mg/mL)
- Reconstruction Buffer (0.1M NaOH, 0.2M HEPES, 2.2% NaHCO3)
- Cell Culture Medium (e.g., DMEM/F12)
- Mammary epithelial cells (e.g., MCF10A)
- NIH/3T3 conditioned medium (for stromal cues)
- Sterile pipettes, tubes, 24-well plates
Procedure:
- Calculate Volumes: Determine final gel volume (e.g., 500 µL/well). For a target collagen concentration (e.g., 4 mg/mL for ~2 kPa), calculate volumes of collagen stock, reconstruction buffer, medium, and cell suspension.
- Neutralize Collagen: In a sterile tube on ice, combine cold reconstruction buffer and cell culture medium. Slowly add the calculated volume of acidic collagen stock. Mix gently by pipetting. Avoid bubbles.
- Add Cells: Add pre-counted cell suspension (e.g., 1.0 x 10^5 cells/mL) to the neutralized collagen mixture. Mix gently.
- Polymerize: Immediately pipet the cell-collagen mixture into wells of a pre-warmed 24-well plate (200-500 µL/well). Transfer to a 37°C, 5% CO2 incubator for 45-60 minutes.
- Add Culture Medium: After complete polymerization, carefully overlay gels with appropriate complete medium (e.g., MCF10A growth medium with 5% NIH/3T3 conditioned medium).
- Stiffness Validation: Perform rheology (oscillatory shear) on acellular gels prepared in parallel to confirm storage modulus (G').
Protocol 2: Drug Treatment and Cytoskeletal Integrity Assessment in 3D Gels
Objective: To evaluate the efficacy of a candidate ROCK inhibitor on disrupting actin organization in 3D culture.
Materials:
- Established 3D collagen gels with cells (from Protocol 1)
- ROCK inhibitor (e.g., Y-27632, 10 mM stock in DMSO)
- Vehicle control (0.1% DMSO in medium)
- Phalloidin (e.g., Alexa Fluor 488-conjugated)
- Paraformaldehyde (4% in PBS)
- Permeabilization buffer (0.5% Triton X-100 in PBS)
- Blocking buffer (5% BSA in PBS)
- Confocal microscope
Procedure:
- Treatment: After 3-5 days of 3D culture, aspirate medium and replace with fresh medium containing the ROCK inhibitor at desired concentrations (e.g., 1, 5, 10 µM Y-27632) or vehicle control. Incubate for 6-24 hours.
- Fixation: Aspirate medium. Gently wash gels twice with PBS. Fix with 4% PFA for 45-60 minutes at room temperature.
- Permeabilization and Blocking: Wash 3x with PBS. Permeabilize with 0.5% Triton X-100 for 30 min. Wash again. Block with 5% BSA for 2 hours at room temperature.
- Staining: Incubate gels with phalloidin conjugate (1:200 in blocking buffer) overnight at 4°C, protected from light.
- Imaging: Wash thoroughly (3x, 1 hour each). Image using a confocal microscope with Z-stack acquisition (e.g., 2 µm steps) to capture 3D actin architecture.
- Analysis: Quantify morphological parameters (e.g., cell roundness, actin filament length, cortical intensity) using image analysis software (e.g., FIJI/ImageJ).
Signaling Pathway Diagrams
Title: Rho/ROCK Mechanotransduction Pathway & Drug Inhibition
Title: Experimental Workflow for 3D Cytoskeletal Drug Testing
The Scientist's Toolkit: Research Reagent Solutions
Table 3: Essential Materials for Recapitulating the 3D Microenvironment
| Reagent/Material | Example Product(s) | Function in Experiment |
|---|---|---|
| Basement Membrane Extract | Corning Matrigel, Cultrex BME | Provides complex, biologically active ECM for organoid and epithelial culture. |
| Collagen I, High Concentration | Rat tail Collagen I (8-12 mg/mL) | The primary tunable scaffold for many connective tissue models; stiffness controlled by concentration/polymerization. |
| Fibrinogen/Thrombin Kit | Sigma Fibrinogen from plasma | Forms fibrin hydrogels for muscle, vascular, or neural models; stiffness tuned by concentration. |
| Synthetic Hydrogel Precursors | PEGDA (Polyethylene glycol diacrylate), GelMA | Chemically defined, photopolymerizable gels for precise mechanical control and functionalization. |
| Mechanosensitive Reporter Cell Line | YAP/TAZ-GFP, SRC FRET biosensor | Live-cell readout of pathway activation in response to matrix and drug treatment. |
| Cytoskeletal-Targeting Inhibitors | Y-27632 (ROCK), Latrunculin A (actin), NSC 668394 (Arp2/3) | Pharmacological tools to disrupt specific cytoskeletal nodes for functional studies. |
| Tracers for Matrix Rheology | Fluorescent microbeads (1 µm) | Embedded in acellular hydrogels for quantification of local stiffness via particle tracking microrheology. |
Key Diseases and Pathways Involving Cytoskeletal Dysregulation (Cancer Metastasis, Neurodegeneration, Fibrosis)
Introduction Cytoskeletal dysregulation is a fundamental pathological mechanism driving progression in diverse diseases, including cancer metastasis, neurodegeneration, and fibrotic disorders. Investigating these pathways requires advanced models that recapitulate the 3D tissue microenvironment. This application note, framed within a broader thesis on 3D cell culture models for cytoskeletal drug testing, details key dysregulated pathways, quantitative findings, and standardized protocols for target validation and therapeutic screening in physiologically relevant in vitro systems.
1. Key Pathways and Quantitative Data
Table 1: Core Cytoskeletal Dysregulation Pathways in Disease
| Disease Context | Key Dysregulated Pathway | Central Molecular Players | Functional Outcome | Evidence (Example Readout) |
|---|---|---|---|---|
| Cancer Metastasis | Rho GTPase (RhoA/ROCK, Rac1, Cdc42) | RhoA, ROCK1/2, LIMK, Cofilin, Myosin II | Enhanced actomyosin contractility, invadopodia formation, & mesenchymal motility. | ↑ Invasion (3D Matrigel) by 250-400% in metastatic vs. parental lines. |
| Neurodegeneration (e.g., AD) | Tau & Microtubule Stability | Hyperphosphorylated Tau, MAPs, GSK3β, CDK5 | Microtubule destabilization, impaired axonal transport, & neurofibrillary tangle formation. | ↓ Microtubule polymerization rate by ~60% in Tau-P301L models. |
| Fibrosis (e.g., IPF, Cardiac) | Stress Fiber & Focal Adhesion Signaling | RhoA/ROCK, MRTF-A/SRF, α-SMA, FAK, Paxillin | Excessive ECM production & sustained myofibroblast contraction. | ↑ α-SMA+ stress fibers in >80% of fibroblasts in 3D collagen gels. |
| Cross-Cutting Mechanism | YAP/TAZ Mechanotransduction | YAP/TAZ, LATS1/2, F-actin, Nuclear Pores | Nuclear translocation of transcriptional co-activators in response to cytoskeletal tension. | Nuclear YAP localization increases 3.5-fold on stiff (40 kPa) vs. soft (2 kPa) substrates. |
2. Detailed Experimental Protocols
Protocol 2.1: 3D Spheroid Invasion Assay for Metastatic Potential & ROCK Inhibition Purpose: To quantify the invasive capacity of cancer cells and test ROCK inhibitor efficacy in a 3D matrix. Materials: Low-adhesion U-bottom plates, growth medium, fluorescent cell tracker (e.g., CMFDA), growth factor-reduced Matrigel, invasion medium (with serum or chemoattractants), ROCK inhibitor (e.g., Y-27632, 10 µM), confocal microscope. Procedure:
- Spheroid Formation: Seed 5,000 cells/well in a U-bottom plate. Centrifuge at 300 x g for 3 min. Incubate for 48-72h to form compact spheroids.
- Embedding: Prepare a cold mixture of Matrigel and invasion medium (1:1). Carefully transfer individual spheroids into 50 µL droplets of the mix in a 24-well plate (pre-chilled). Incubate at 37°C for 30 min to polymerize.
- Treatment & Invasion: Overlay with 500 µL invasion medium ± ROCK inhibitor. Incubate for 72h.
- Imaging & Quantification: Image spheroids daily using a confocal microscope (z-stacks). Quantify invasive area: (Total area - core area) / core area. Express as % change vs. control.
Protocol 2.2: Assessment of Neuronal Microtubule Stability in 3D Hydrogels Purpose: To evaluate drug effects on microtubule integrity in 3D-cultured neurons. Materials: Primary neurons, soft 3D hydrogel (e.g., ~1 kPa PEG or HA-based), poly-D-lysine, microtubule-stabilizing agent (e.g., Paclitaxel, 100 nM), destabilizing agent (e.g., Nocodazole, 10 µM), anti-βIII-Tubulin & anti-acetylated Tubulin antibodies, wash buffer. Procedure:
- 3D Culture: Encapsulate neurons in soft hydrogel per manufacturer's protocol. Culture in neurobasal medium for 7-10 days to allow process extension.
- Drug Treatment: Treat cultures with vehicle, Paclitaxel, or Nocodazole for 24h.
- Immunostaining: Fix with 4% PFA for 45 min. Permeabilize/block (0.3% Triton X-100, 5% BSA). Incubate with primary antibodies (βIII-Tubulin, Acetylated Tubulin) overnight at 4°C.
- Imaging/Analysis: Image using super-resolution or confocal microscopy. Analyze microtubule density (βIII-Tubulin signal intensity/neurite area) and stability ratio (Acetylated Tubulin / Total βIII-Tubulin intensity).
Protocol 2.3: Contraction & Activation Assay for Myofibroblasts in 3D Collagen Lattices Purpose: To measure fibroblast-to-myofibroblast transition and contractile output. Materials: Primary fibroblasts (e.g., lung or cardiac), rat tail collagen I, neutralization solution (NaOH/HEPES), contraction plates (non-adherent), TGF-β1 (10 ng/mL), ROCK inhibitor (Y-27632, 10 µM), anti-α-SMA antibody. Procedure:
- Lattice Preparation: Mix cells (2.5 x 10^5/mL) with collagen I (1.5 mg/mL) in cold neutralization buffer. Rapidly aliquot 500 µL/well into a 24-well plate. Polymerize at 37°C for 1h.
- Treatment: Carefully release lattices from well edges. Add medium ± TGF-β1 ± Y-27632.
- Contraction Measurement: Photograph lattices at 0, 24, 48, and 72h. Quantify area using ImageJ. Calculate % contraction: [(Initial Area - Final Area) / Initial Area] * 100.
- Phenotype Analysis: Fix lattices at endpoint, process for histology, and stain for α-SMA. Report % α-SMA positive cells.
3. Pathway & Workflow Visualizations
Rho-ROCK Pathway in Cancer Metastasis
Tau & Microtubule Dysregulation in Neurodegeneration
Myofibroblast Activation Pathway in Fibrosis
3D Cytoskeletal Drug Testing Workflow
4. The Scientist's Toolkit: Research Reagent Solutions
Table 2: Essential Reagents for 3D Cytoskeletal Research
| Reagent/Material | Supplier Examples | Function in 3D Cytoskeletal Assays |
|---|---|---|
| Growth Factor-Reduced Matrigel | Corning, Bio-Techne | Gold-standard basement membrane matrix for 3D invasion and morphogenesis studies. |
| Type I Collagen, Rat Tail | Corning, Advanced BioMatrix | Major ECM component for fibroblast contraction assays and stromal modeling. |
| Tunable Synthetic Hydrogels (PEG, HA) | Cellendes, Sigma-Aldrich, CubeBiotech | Enable precise control over stiffness and biochemical cues for mechanotransduction studies. |
| ROCK Inhibitors (Y-27632, Fasudil) | Tocris, Selleckchem | Pharmacological tools to inhibit Rho/ROCK-mediated actomyosin contractility. |
| Microtubule Stabilizer (Paclitaxel) & Destabilizer (Nocodazole) | Sigma-Aldrich, MedChemExpress | Control compounds for probing microtubule dynamics and stability. |
| Live-Cell Actin & Tubulin Dyes (SiR-Actin, Tubulin-Tracker) | Spirochrome, Cytoskeleton Inc. | Enable real-time, high-resolution visualization of cytoskeletal dynamics in live 3D cultures. |
| Phospho-Specific Antibodies (p-MLC, p-Cofilin, p-Tau) | Cell Signaling Technology, Abcam | Critical for detecting pathway activation states via immunofluorescence or WB. |
| Low-Adhesion U-/V-Bottom Plates | Greiner Bio-One, Perfecta3D | Facilitate reliable formation of uniform, single spheroids for high-throughput screening. |
Current Landscape and Commercial Availability of 3D Culture Platforms for Drug Screening
Three-dimensional (3D) cell culture platforms have become indispensable for drug screening, providing physiologically relevant models that bridge the gap between traditional 2D monolayers and in vivo systems. This is particularly critical for cytoskeletal drug testing, where cell-ECM interactions and spatial architecture dramatically influence drug efficacy and mechanisms of action. The commercial landscape is diverse, offering solutions tailored for high-throughput screening (HTS), high-content analysis (HCA), and mechanistic studies.
Table 1: Quantitative Overview of Leading 3D Culture Platform Types for Drug Screening
| Platform Type | Key Commercial Vendors (Examples) | Typical Throughput | Approx. Cost per Well (USD) | Primary 3D Structure | Best Suited for Cytoskeletal Analysis |
|---|---|---|---|---|---|
| Spheroid/UAH (Ultra-Low Attachment) | Corning, Greiner Bio-One, PerkinElmer | 96- to 1536-well | $0.50 - $2.00 | Multicellular Aggregates | Moderate (internal architecture) |
| Hydrogel/ECM-Based | Corning (Matrigel, Collagen), Cultrex, TheWell Bioscience | 96- to 384-well | $5.00 - $20.00 | Embedded or Layered Cultures | High (cell-ECM engagement) |
| Scaffold-Based | REPROCELL (Alvetex), 3D Biotek | 24- to 96-well | $10.00 - $50.00 | Porous Scaffold Infiltration | High (3D migration/invasion) |
| Organ-on-a-Chip (Microfluidic) | Emulate, MIMETAS, CN Bio Innovations | 4- to 96-chip | $50 - $200+ | Perfused Tubular Structures | Very High (shear stress effects) |
| Magnetic Levitation | Greiner Bio-One (NanoShuttle) | 96- to 384-well | $3.00 - $10.00 | Magnetic Aggregates | Moderate (rapid assembly) |
Application Notes: Platform Selection for Cytoskeletal Drug Testing
Note 1: High-Content Analysis of Cytoskeletal Disruption. For screening compounds targeting actin or tubulin dynamics, hydrogel-based 3D cultures (e.g., in Matrigel) are optimal. They preserve native cell polarity and allow for high-resolution 3D confocal imaging of filament networks. Commercial HCA-compatible plates (e.g., Corning Spheroid Microplates) enable automated imaging and quantification of morphological features. Note 2: Testing Migration/Invasion Inhibitors. Scaffold-based platforms like Alvetex provide a rigid 3D framework ideal for quantifying cell invasion depth in response to cytoskeletal drugs. Staining for F-actin and focal adhesion kinase (FAK) alongside nuclei allows for correlative analysis of inhibition. Note 3: Evaluating Mechanotransduction Effects. Organ-on-a-chip platforms uniquely allow the application of fluid shear stress or cyclic strain. This is crucial for drugs whose efficacy may depend on cellular mechanical cues, requiring analysis of stress fiber formation and nuclear translocation of YAP/TAZ.
Detailed Experimental Protocols
Protocol 1: Generating & Treating Cancer Spheroids for Cytoskeletal Drug Screening in ULA Plates. Objective: To screen anti-cytoskeletal drugs on 3D spheroids and assess viability and morphology. Materials: See "The Scientist's Toolkit" below. Workflow Diagram Title: 3D Spheroid Drug Screening Workflow
Procedure:
- Spheroid Formation: Prepare a single-cell suspension of the target cell line (e.g., U2OS osteosarcoma). Seed 5,000-10,000 cells per well in a 96-well U-bottom ULA plate. Centrifuge the plate at 500 x g for 5 minutes to aggregate cells at the well bottom. Incubate at 37°C, 5% CO₂ for 72 hours to form compact spheroids.
- Drug Treatment: After 72h, prepare serial dilutions of cytoskeletal drugs (e.g., Latrunculin A, Paclitaxel) in complete medium. Carefully aspirate 100 µL of old medium from each well and replace with 100 µL of drug-containing medium. Include DMSO vehicle controls. Incubate for an additional 48-96 hours.
- Endpoint Analysis:
- Viability: Transfer the spheroid plate to room temperature. Add 100 µL of CellTiter-Glo 3D Reagent directly to each well. Shake orbitally for 5 minutes, then incubate for 25 minutes in the dark. Record luminescence on a plate reader.
- Cytoskeletal Imaging: Aspirate medium. Fix spheroids with 4% PFA for 1 hour. Permeabilize with 0.5% Triton X-100 for 30 minutes. Stain with phalloidin-Alexa Fluor 488 (1:500) and DAPI (1 µg/mL) overnight at 4°C. Image using a confocal microscope with Z-stacking. Use software (e.g., Fiji/ImageJ) to quantify spheroid volume and fluorescence intensity.
Protocol 2: 3D Invasion Assay in a Collagen I Hydrogel for Cytoskeletal Inhibitors. Objective: To quantify the inhibitory effect of drugs on cell invasion in a physiomimetic ECM. Materials: See "The Scientist's Toolkit." Workflow Diagram Title: 3D Collagen Invasion Assay Protocol
Procedure:
- Gel Preparation: On ice, mix rat tail Collagen I (final conc. 2 mg/mL), 10x PBS, 1N NaOH (to neutralize), and complete medium. Keep the solution on ice.
- Cell Embedding: Trypsinize and count invasive cells (e.g., HT1080 fibrosarcoma). Centrifuge and resuspend at 2.0 x 10⁵ cells/mL in cold complete medium. Mix the cell suspension 1:1 with the cold collagen solution to achieve a final density of 1.0 x 10⁵ cells/mL in 1 mg/mL collagen.
- Polymerization: Immediately pipette 50 µL of the cell-collagen mixture into each well of a 96-well plate. Tilt the plate to ensure even coating. Incubate at 37°C for 1 hour to allow polymerization.
- Drug Treatment & Invasion: After polymerization, gently overlay each well with 100 µL of complete medium containing the cytoskeletal drug or vehicle control. Incubate for 72 hours.
- Fixation and Staining: Aspirate medium. Fix cells by adding 4% PFA directly to the gel for 1 hour. Permeabilize with 0.5% Triton X-100 for 1 hour. Stain with phalloidin and DAPI as in Protocol 1.
- Imaging & Analysis: Acquire confocal Z-stacks from the top to the bottom of the gel. Use image analysis software to measure the maximum invasion depth of cells from the gel surface and quantify changes in F-actin organization.
The Scientist's Toolkit: Research Reagent Solutions
Table 2: Essential Materials for 3D Cytoskeletal Drug Screening
| Item (Commercial Example) | Function in 3D Cytoskeletal Research |
|---|---|
| Ultra-Low Attachment (ULA) Plates (Corning Spheroid Microplates) | Promotes spontaneous spheroid formation via inhibited cell attachment, ideal for aggregate-based screening. |
| Basement Membrane Extract (Corning Matrigel) | Gold-standard reconstituted ECM hydrogel for studying cell-ECM interactions, polarity, and invasion. |
| Rat Tail Collagen I (Corning Collagen I) | Defined hydrogel for 3D invasion assays, providing a fibrillar matrix for studying mechanosensing. |
| 3D Viability Assay (Promega CellTiter-Glo 3D) | Optimized luminescent ATP assay for accurate viability readouts in 3D structures. |
| Cytoskeletal Probes (Thermo Fisher Phalloidin conjugates) | High-affinity fluorescent probes (e.g., Alexa Fluor 488) for visualizing F-actin architecture in fixed samples. |
| Live-Cell Cytoskeletal Dyes (SiR-actin/tubulin, Cytoskeleton Inc.) | Fluorogenic, cell-permeable probes for real-time tracking of cytoskeletal dynamics in living 3D cultures. |
| 3D-Tissue Clearing Kits (Miltenyi Biotec MACS) | Enable deep imaging of large spheroids or organoids by rendering them optically transparent. |
| High-Content Imaging System (PerkinElmer Opera Phenix, ImageXpress Micro Confocal) | Automated confocal micro-scopes for acquiring high-resolution Z-stacks of 3D models in multiwell plates. |
Key Signaling Pathways in 3D Cytoskeletal Drug Response
Pathway Diagram Title: Core Pathways in 3D Cytoskeletal Drug Response
Building Better Models: A Step-by-Step Guide to 3D Cytoskeletal Assays
Within cytoskeletal drug testing research, selecting an appropriate 3D cell culture model is critical for predicting clinical efficacy and toxicity. These models—spheroids, organoids, scaffold-based, and bioprinted tissues—recapitulate key aspects of the tumor microenvironment and tissue architecture that influence cytoskeletal dynamics and drug response. This Application Note provides a comparative analysis, protocols, and tools to guide model selection.
Comparative Analysis of 3D Models
Table 1: Key Characteristics & Quantitative Metrics for 3D Model Selection
| Feature | Spheroids | Organoids | Scaffold-Based | Bioprinted Tissues |
|---|---|---|---|---|
| Definition | Aggregates of cells (cancer/primary). | Stem cell-derived, self-organizing structures. | Cells seeded into natural/synthetic matrices. | Layer-by-layer deposition of bioinks containing cells. |
| Complexity | Low to Moderate. | High (exhibits multicellular lineage differentiation). | Moderate (dependent on scaffold design). | User-defined, can be high. |
| Throughput | High (U/Low-attachment plates). | Moderate to Low. | Moderate. | Low (current technologies). |
| Reproducibility | High for homotypic. | Moderate (batch-to-batch variability). | High with standardized scaffolds. | Improving, but can vary. |
| Cytoskeletal Relevance | Basic cell-cell adhesion, polarity. | Native-like tissue organization & forces. | Tunable mechanical cues (stiffness). | Precise control over mechanical microenvironment. |
| Typical Size Range | 200 - 500 µm diameter. | 100 - 500+ µm. | Scale dictated by scaffold. | Millimetre to centimetre scale. |
| Cost per Model | Low ($0.50 - $5). | High ($10 - $100+). | Moderate ($5 - $20). | High ($20 - $100+). |
| Time for Maturation | 3 - 7 days. | 10 - 30+ days. | 7 - 14 days. | 1 - 7 days (post-printing culture). |
| Key Applications in Drug Testing | High-throughput screening, penetration studies. | Disease modeling, personalized therapy. | Mechanotransduction studies, migration. | Complex tissue modeling, vascularization studies. |
Table 2: Suitability for Cytoskeletal Drug Testing
| Model Type | Suitability for Actin-Targeting Drugs | Suitability for Tubulin-Targeting Drugs | Key Advantage for Cytoskeletal Research |
|---|---|---|---|
| Spheroids | Medium - Good for penetration effects. | Good for core vs. periphery effects. | Simple model for drug gradient formation. |
| Organoids | Excellent (native tissue tension). | Excellent (native microtubule organization). | Patient-specific cytoskeletal architecture. |
| Scaffold-Based | Excellent (tunable matrix stiffness). | Good for migration inhibition studies. | Isolate effects of extracellular mechanics. |
| Bioprinted Tissues | Excellent (precision patterning of forces). | Good (spatial control of cell types). | Model multicellular cytoskeletal interactions. |
Detailed Experimental Protocols
Protocol 3.1: Generation of Cancer Spheroids for Drug Screening
Objective: To produce uniform, high-throughput spheroids for cytoskeletal drug testing (e.g., paclitaxel efficacy). Materials: See "Scientist's Toolkit" (Table 3). Workflow:
- Prepare a single-cell suspension of your cancer cell line (e.g., MCF-7) at 1-5 x 10³ cells/mL in complete medium.
- Seed 100 µL/well into a 96-well ultra-low attachment (ULA) round-bottom plate.
- Centrifuge the plate at 300 x g for 3 minutes to aggregate cells at the well bottom.
- Incubate at 37°C, 5% CO₂ for 72-96 hours to form compact spheroids.
- At day 4, image spheroids to ensure uniform size (~200-300 µm). Add 100 µL of medium containing 2X concentration of the cytoskeletal drug (e.g., paclitaxel, 0-100 nM).
- Incubate for 72-120 hours. Assess viability via ATP-based luminescence assay (e.g., CellTiter-Glo 3D).
- For cytoskeletal analysis, fix spheroids in 4% PFA, permeabilize, and stain for F-actin (Phalloidin) and nuclei (DAPI). Image using confocal microscopy.
Protocol 3.2: Establishing Patient-Derived Organoids for Cytoskeletal Assessment
Objective: To establish and treat colon cancer organoids for evaluating myosin-targeting drugs. Materials: See "Scientist's Toolkit" (Table 3). Workflow:
- Embedding: Mix digested patient-derived tumor cells with cold BME/Matrigel (~70% v/v). Plate 10-20 µL domes in pre-warmed 24-well plates. Polymerize for 30 minutes at 37°C.
- Culture: Overlay with organoid complete medium (e.g., IntestiCult). Refresh every 2-3 days.
- Passaging: Harvest organoids at 7-14 day intervals. Mechanically/ enzymatically disrupt, then re-embed as in Step 1.
- Drug Treatment: At passage 2-3, add drugs (e.g., Blebbistatin) to the overlay medium. Treat for 5-7 days.
- Analysis: For live imaging of cytoskeletal disruption, transfer an organoid-BME dome to a glass-bottom dish. Image using time-lapse microscopy. For endpoint analysis, fix and perform 3D immunofluorescence for phospho-myosin light chain.
Protocol 3.3: Drug Testing on Cells in 3D Scaffolds
Objective: To test the effect of matrix stiffness on actin-disrupting drug (Latrunculin A) efficacy. Materials: See "Scientist's Toolkit" (Table 3). Workflow:
- Scaffold Preparation: Use tunable hydrogels (e.g., PEG-based). Prepare two stiffness conditions: 1 kPa (soft) and 20 kPa (stiff) following manufacturer's instructions.
- Cell Encapsulation: Mix fibroblasts (e.g., NIH/3T3) with the pre-polymer solution at 1 x 10⁶ cells/mL. Pipette 50 µL into molds. Polymerize.
- Culture: Transfer scaffolds to medium and culture for 48 hours to allow cell spreading and adaptation.
- Treatment: Add Latrunculin A (0-1 µM) to the medium. Incubate for 24 hours.
- Assessment: Fix, stain for F-actin and nuclei. Use confocal z-stacks to quantify mean fluorescence intensity (MFI) of F-actin per cell as a function of stiffness and drug dose.
Visualizations
Diagram 1: Cytoskeletal Drug Action in 3D Models
Diagram Title: Drug Response Differs in 2D vs 3D Models
Diagram 2: Experimental Workflow for 3D Model Selection
Diagram Title: Decision Flowchart for 3D Model Selection
The Scientist's Toolkit
Table 3: Key Research Reagent Solutions for 3D Cytoskeletal Studies
| Item | Function | Example Product/Brand |
|---|---|---|
| Ultra-Low Attachment (ULA) Plates | Promotes cell aggregation via hydrophilic, neutrally charged surfaces for spheroid formation. | Corning Spheroid Microplates, Nunclon Sphera |
| Basement Membrane Extract (BME) | Provides a complex, biologically active scaffold for organoid growth and differentiation. | Cultrex Basement Membrane Extract, Matrigel |
| Tunable Synthetic Hydrogels | Decouples biochemical and mechanical cues; allows precise control of stiffness for scaffold studies. | PEG-based kits (e.g., Cellendes), Alvetex Scaffold |
| Bioink | A printable material containing cells and/or biomaterials for creating 3D bioprinted structures. | GelMA, BioINK (CELLINK), alginate-based inks |
| 3D Viability Assay | Luminescent/fluorescent assay optimized for penetrating 3D structures and quantifying ATP. | CellTiter-Glo 3D, PrestoBlue 3D |
| Cytoskeletal Stains | High-affinity probes for visualizing F-actin or microtubules in fixed 3D samples. | Phalloidin conjugates (e.g., Alexa Fluor), Anti-α-Tubulin antibodies |
| Deep Well Imaging Plates | Allows high-content imaging of 3D models with optimal optical clarity and working distance. | Greiner µClear, Falcon Imaging Plates |
| Selective ROCK Inhibitor | Improves viability of single cells during 3D model establishment by reducing anoikis. | Y-27632 (Tocris) |
Protocols for Establishing 3D Cultures for Cytoskeletal Analysis (Matrices, Media, Seeding Density)
Within the broader thesis on advancing 3D cell culture models for cytoskeletal drug testing research, the establishment of robust, reproducible 3D culture protocols is foundational. Unlike 2D monolayers, 3D models recapitulate critical aspects of the in vivo microenvironment, including cell-ECM interactions, gradient formation, and mechanical cues that profoundly influence cytoskeletal architecture, dynamics, and drug response. This document provides detailed application notes and protocols for generating 3D cultures optimized for subsequent cytoskeletal analysis, focusing on matrix selection, medium formulation, and seeding density.
Key Research Reagent Solutions
| Reagent/Material | Function/Benefit |
|---|---|
| Basement Membrane Extract (BME, e.g., Matrigel) | Gold-standard, biologically active hydrogel derived from murine sarcoma; rich in laminin, collagen IV, and growth factors. Promotes epithelial morphogenesis and polarized cytoskeletal organization. |
| Type I Collagen (Rat-tail) | Tunable, fibrillar hydrogel providing biomechanical cues; widely used for stromal and fibroblast cultures. Ideal for studying mechanosensitive cytoskeletal remodeling. |
| Fibrin Gels | Polymerized from fibrinogen and thrombin; offers high elasticity and biodegradability. Suitable for angiogenesis and migration assays with clear cytoskeletal tracks. |
| Alginate Hydrogels | Inert, carbohydrate-based polymer; stiffness controlled by ionic crosslinking (e.g., Ca²⁺). Enables isolation of purely mechanical effects on the cytoskeleton. |
| Synthetic PEG-based Hydrogels | Highly defined, bio-inert platforms; functionalized with adhesive peptides (e.g., RGD) for controlled biochemical and mechanical signaling to cytoskeletal elements. |
| Advanced 3D Media | Typically basal media (DMEM/F12) supplemented with defined factors (e.g., heregulin, B27) and low serum (≤2%) to promote 3D growth while minimizing uncontrolled proliferation. |
| Dispase or Collagenase | Enzymes for gentle recovery of intact 3D structures (e.g., acini, spheroids) from matrices for downstream analysis without cytoskeletal disruption. |
Quantitative Parameters for Protocol Design
Table 1: Comparison of Common 3D Matrices for Cytoskeletal Studies
| Matrix Type | Typical Polymerization | Stiffness Range (kPa) | Key Advantages for Cytoskeletal Analysis | Common Cell Types |
|---|---|---|---|---|
| BME/Matrigel | Thermo-reversible (37°C/4°C) | 0.5 - 2.5 | Physiological ligand density, supports polarity | MCF-10A, Caco-2, MDCK |
| Collagen I | Neutralization & thermo (37°C) | 0.2 - 5.0 (tunable) | Fibrillar structure, user-defined stiffness | Fibroblasts, HT-29, MDA-MB-231 |
| Fibrin | Enzymatic (Thrombin) | 0.1 - 10.0 | High cell-mediated remodeling | Endothelial cells, MSCs |
| Alginate | Ionic (CaCl₂) | 1 - 100+ | Decouples biochemical & mechanical cues | Chondrocytes, encapsulated cells |
| PEG-based | Photo/chemical crosslink | 0.1 - 50+ | Full biochemical/mechanical control | Engineered cell lines, stem cells |
Table 2: Recommended Seeding Densities for 3D Cytoskeletal Cultures
| Culture Format & Matrix | Cell Type | Seeding Density | Expected Morphology (for analysis) |
|---|---|---|---|
| Embedded (BME) | MCF-10A | 5,000 cells/mL gel | Polarized acini (7-10 days) |
| Embedded (Collagen I) | NIH/3T3 | 25,000 cells/mL gel | Dendritic, invasive strands (3-5 days) |
| On-top (BME) | MDA-MB-231 | 10,000 cells/well | Stellate, invasive structures (5-7 days) |
| Aggregation (Low-attachment) | U87 MG | 5,000 cells/spheroid | Compact spheroids (3 days) |
| Microcarrier Beads | CHO-K1 | 100 cells/bead | Uniform monolayer on bead (4 days) |
Detailed Protocols
Protocol 1: Establishing Polarized Epithelial Acini in BME for Actin Analysis
Application: Study apical-basal polarity, lumen formation, and actin cortex organization in response to cytoskeletal drugs.
Materials:
- 8-well chambered coverglass
- Growth-factor reduced (GFR) BME/Matrigel (kept on ice)
- MCF-10A cells
- Assay Medium: DMEM/F12, 2% horse serum, 10 µg/mL insulin, 20 ng/mL EGF, 0.5 µg/mL hydrocortisone, 100 ng/mL cholera toxin, 5% v/v BME.
- Overlay Medium: As above, but with 2% v/v BME.
- Dispase (5 mg/mL in assay medium)
Method:
- Pre-coat Wells: Thaw BME on ice overnight. Keep all tools pre-cooled. Add 40 µL of pure, undiluted BME to each well. Spread evenly and incubate at 37°C for 30 min to gel.
- Prepare Cell-Matrix Mixture: Trypsinize and count MCF-10A cells. Centrifuge and resuspend in cold Assay Medium to 5 x 10⁴ cells/mL. Mix this cell suspension 1:1 with cold BME to achieve a final density of 2.5 x 10⁴ cells/mL of BME. Keep on ice.
- Seed Embedded Culture: Pipette 200 µL of the cell-BME mixture onto the pre-coated well (final: 5,000 cells/well). Avoid bubbles. Incubate at 37°C for 30 min to polymerize.
- Add Overlay Medium: Gently add 300 µL of pre-warmed Overlay Medium on top of the gelled BME.
- Culture and Feed: Culture for 10-14 days, replacing 2/3 of the Overlay Medium every 3 days.
- Processing for Imaging: Aspirate medium. Add 200 µL of Dispase solution and incubate 1 hr at 37°C to digest BME. Gently collect structures by pipetting. Fix with 4% PFA for 20 min for subsequent actin (e.g., Phalloidin) staining and confocal imaging.
Protocol 2: 3D Invasive Culture in Collagen I for Microtubule & Focal Adhesion Analysis
Application: Model cancer cell invasion and analyze microtubule dynamics and focal adhesion complexes in a fibrillar 3D environment.
Materials:
- Rat-tail Collagen I, high concentration (≥8 mg/mL)
- 10X PBS, 0.1M NaOH, sterile H₂O
- Reconstitution Buffer: Mix 10X PBS, 0.1M NaOH, and H₂O to achieve neutrality when added to collagen.
- MDA-MB-231 cells
- Serum-free DMEM
Method:
- Neutralize Collagen: On ice, mix components in this order for 1 mL final gel: 800 µL Collagen I stock, 100 µL 10X PBS, 50 µL sterile H₂O, 50 µL 0.1M NaOH. Mix thoroughly without bubbling. Keep on ice. Validate pH with phenol red (salmon pink).
- Prepare Cell Suspension: Trypsinize and count MDA-MB-231 cells. Pellet and resuspend in cold serum-free DMEM at 5 x 10⁵ cells/mL.
- Form Final Gel Mixture: Mix 950 µL of neutralized collagen with 50 µL of cell suspension (final density: 25,000 cells/mL gel). Gently pipette to mix.
- Polymerize Gel: Quickly aliquot 200 µL per well into a pre-warmed 24-well plate. Incubate at 37°C for 30-45 min.
- Add Culture Medium: Gently add 500 µL of complete growth medium (DMEM + 10% FBS) on top.
- Culture: Maintain for 5-7 days. Medium can be changed after 24 hrs. For drug testing, add compounds directly to the overlay medium.
- Fix for Analysis: Aspirate medium. Fix structures directly in the gel with 4% PFA for 1 hr at RT. Permeabilize with 0.5% Triton X-100. Stain for β-tubulin and paxillin/vinculin for cytoskeletal analysis.
Experimental Workflow and Pathway Diagrams
Title: 3D Culture & Analysis Workflow
Title: 3D Matrix to Cytoskeleton Signaling
Within the thesis on advancing 3D cell culture models for cytoskeletal-targeted drug testing, the ability to accurately capture and measure cytoskeletal architecture and dynamics in three dimensions is paramount. This application note details protocols for imaging and quantitative analysis of filamentous actin (F-actin) and microtubules in 3D spheroid and hydrogel models, providing critical readouts for assessing drug efficacy and mechanisms of action.
Key Research Reagent Solutions
Table 1: Essential Reagents and Materials for 3D Cytoskeletal Analysis
| Item | Function/Brief Explanation |
|---|---|
| Fluorescent Phalloidin (e.g., Alexa Fluor 488/568/647 conjugate) | High-affinity probe for staining and quantifying F-actin. Crucial for visualizing cortical and stress fiber morphology in 3D. |
| Anti-α-Tubulin Antibody (with suitable secondary) | Immunostaining of microtubule networks to assess organization, polarity, and stability. |
| SiR-Actin / SiR-Tubulin Live-Cell Probes (Cytoskeleton Inc.) | Cell-permeable, far-red fluorescent probes for long-term, low-phototoxicity live imaging of cytoskeletal dynamics in 3D cultures. |
| Fibrillar Collagen I Hydrogel (e.g., Corning Matrigel or rat tail Collagen I) | Provides a physiologically relevant 3D extracellular matrix for cell embedding, influencing cytoskeletal organization. |
| PFA (Paraformaldehyde) 4%, with 0.1-0.5% Glutaraldehyde | Fixation solution for superior preservation of cytoskeletal structures in 3D matrices. Glutaraldehyde crosslinking prevents artifact-induced depolymerization. |
| Triton X-100 or Saponin | Detergent for permeabilizing cell and organelle membranes to allow probe penetration into 3D samples. |
| Mounting Medium with High Refractive Index (e.g., RIMS / SeeDB2G) | Essential for reducing spherical aberration during deep imaging of cleared or thick 3D samples. |
| Spinning Disk or Lattice Light-Sheet Microscope | Imaging systems enabling fast, high-resolution, low-phototoxicity Z-stack acquisition of live or fixed 3D samples. |
Protocols
Protocol 3.1: Fixation and Immunostaining of Cytoskeleton in 3D Hydrogel Cultures
- Aim: Preserve and label F-actin and microtubules in cells grown in 3D matrices for high-resolution confocal imaging.
- Materials: Cells in 3D hydrogel, PFA/Glutaraldehyde fixative, PBS, Quenching Buffer (100 mM Glycine in PBS), Permeabilization Buffer (0.5% Triton X-100, 1% BSA in PBS), Blocking Buffer (3% BSA, 0.1% Tween-20 in PBS), Primary/Secondary Antibodies, Fluorescent Phalloidin, High-RI Mounting Medium.
- Procedure:
- Fixation: Aspirate culture medium. Add 4% PFA / 0.1% glutaraldehyde in PBS directly to the hydrogel. Incubate for 1 hour at RT.
- Quenching: Remove fixative, wash 3x with PBS. Incubate with Quenching Buffer for 20 min to neutralize free aldehydes.
- Permeabilization & Blocking: Incubate with Permeabilization Buffer for 1 hour. Replace with Blocking Buffer for 2-4 hours at RT on a gentle shaker.
- Primary Antibody Incubation: Dilute anti-α-Tubulin (1:500) in Blocking Buffer. Add to sample, incubate at 4°C for 48 hours with gentle agitation.
- Washing: Wash 5x over 24 hours with PBS containing 0.1% Tween-20 (PBST).
- Secondary Antibody & Phalloidin Incubation: Prepare cocktail of secondary antibody (e.g., Alexa Fluor 568, 1:500) and fluorescent Phalloidin (1:200) in Blocking Buffer. Incubate for 24 hours at 4°C, protected from light.
- Final Wash & Mounting: Wash 5x over 24 hours with PBST. Excise hydrogel, mount in refractive index matching solution (RIMS) on a glass-bottom dish. Seal and store at 4°C in the dark prior to imaging.
Protocol 3.2: Live-Cell Imaging of Cytoskeletal Dynamics in Spheroids
- Aim: Capture time-lapse 3D data of cytoskeletal remodeling in response to drug treatment.
- Materials: Live spheroids in glass-bottom 96-well plate, SiR-Actin (or SiR-Tubulin) probe, Live-cell imaging medium (fluorophore-free, with HEPES), Microscope with environmental chamber (37°C, 5% CO₂).
- Procedure:
- Labeling: Add SiR-Actin to the culture medium at a final concentration of 100 nM. Incubate for 2-4 hours under normal growth conditions.
- Preparation: Prior to imaging, replace medium with fresh, pre-warmed live-cell imaging medium containing the probe.
- Drug Addition: Add vehicle or cytoskeletal-targeting drug (e.g., Latrunculin A for actin, Nocodazole for microtubules) at desired concentration directly to the well.
- Microscopy Setup: Place plate in environmental chamber. Using a spinning disk confocal, set Z-stack range to encompass the entire spheroid (e.g., 150 µm total, 1 µm steps). Set time interval to 5-10 minutes for 8-24 hours.
- Acquisition: Begin time-lapse acquisition using low laser power (5-10%) and short exposure times (100-300 ms) to minimize phototoxicity.
Quantitative Analysis and Data Presentation
Table 2: Key Quantitative Metrics for 3D Cytoskeletal Analysis
| Metric | Description | Method/Tool | Application in Drug Testing |
|---|---|---|---|
| 3D Filament Orientation | Quantifies alignment and anisotropy of actin fibers or microtubules. | Directionality analysis (Fourier Component) in FIJI/ImageJ. | Detects drug-induced disruption of directional cytoskeletal organization (e.g., from Rac1 inhibitors). |
| Fluorescence Intensity Distribution (Skewness) | Measures heterogeneity of cytoskeletal protein distribution. | Calculated from intensity histograms of Z-stack maximum projections. | Identifies consolidation or dispersion of filaments (high skew = consolidated bundles). |
| Sphericity/Cell Roundness (3D) | Calculated from 3D actin membrane mask. Ratio of surface area to volume (perfect sphere = 1). | Surface rendering and measurement in Imaris or Arivis Vision4D. | Measures drug-induced cell rounding (e.g., via Rho kinase inhibition). |
| Microtubule Growth Rate | Velocity of microtubule plus-end elongation in live cells. | Kymograph analysis from +TIP (EB3-GFP) time-lapses. | Quantifies anti-mitotic drug effects (e.g., Paclitaxel suppression of dynamics). |
| Local Fiber Density | Punctate density of cytoskeletal filaments within a defined 3D volume. | 3D particle analysis or local thresholding in Bitplane Imaris. | Maps regions of cytoskeletal collapse or hyper-polymerization after treatment. |
| Network Mesh Size | Average inter-filament distance within the 3D cytoskeletal network. | Skeletonization and distance transform analysis using FIJI plugins. | Characterizes global network coarseness or densification. |
Visualizations
- Short Title: 3D Cytoskeleton Analysis Workflow
- Short Title: Rho/ROCK Pathway & Cytoskeletal Readouts
Within modern cytoskeletal drug testing research, 3D cell culture models have become indispensable for mimicking the physiological complexity of tissues. The broader thesis posits that functional, biophysical readouts—invasion, contraction, stiffness, and polarity—are more predictive of in vivo efficacy and toxicity than simple 2D viability assays. This application note details protocols and analytical methods for quantifying these key functional endpoints in 3D models to elucidate drug effects on the cytoskeleton and cellular mechanics.
Research Reagent Solutions Toolkit
| Reagent/Material | Function in 3D Assays |
|---|---|
| Fibrinogen/Thrombin | Forms a tunable, physiologically relevant 3D fibrin hydrogel for embedding cells, allowing invasion and contraction measurement. |
| Type I Collagen (High Concentration) | Standard matrix for organotypic stiffness and invasion assays; provides structural and biochemical cues. |
| Matrigel/Basement Membrane Extract | Soluble or gelled form used for polarity assays (e.g., cyst formation) and invasion studies, rich in laminin and growth factors. |
| Traction Force Microscopy (TFM) Beads | Fluorescent or plain microbeads embedded in gels to quantify cellular contractile forces through displacement tracking. |
| Atomic Force Microscopy (AFM) Cantilevers | Tips (colloidal or sharp) used to apply nano-scale forces to cells or matrices to measure local and bulk stiffness. |
| Cytoskeletal Drugs (e.g., Y-27632, Latrunculin A, Nocodazole) | Small molecule inhibitors targeting ROCK (contraction), actin polymerization, or microtubule dynamics, serving as experimental controls. |
| Phalloidin (Fluorescent conjugate) | Stains filamentous actin (F-actin) for visualizing cytoskeletal architecture and cell polarity in fixed samples. |
| Anti-ZO-1 & Anti-GM130 Antibodies | Markers for apical (tight junctions) and Golgi apparatus positioning, respectively, used to quantify epithelial cell polarity. |
Table 1: Expected effects of canonical cytoskeletal inhibitors on functional endpoints in a 3D fibroblast-embedded fibrin model.
| Drug (Target) | Invasion Distance (μm, 72h) | Gel Contraction (% Area Reduction, 48h) | Pericellular Stiffness (kPa, AFM) | Polarity Index |
|---|---|---|---|---|
| Control (DMSO) | 350 ± 45 | 65 ± 8 | 2.1 ± 0.3 | 0.92 ± 0.05 |
| Y-27632 (ROCK) | 120 ± 30 ↓ | 15 ± 5 ↓ | 1.2 ± 0.2 ↓ | 0.85 ± 0.08 |
| Latrunculin A (Actin) | 50 ± 20 ↓↓ | 5 ± 3 ↓↓ | 0.8 ± 0.1 ↓↓ | 0.45 ± 0.10 ↓↓ |
| Nocodazole (Microtubules) | 500 ± 60 ↑ | 40 ± 7 ↓ | 1.8 ± 0.4 | 0.40 ± 0.12 ↓↓ |
Data are illustrative means ± SD. Polarity Index ranges from 0 (non-polar) to 1 (perfectly polarized). Arrows indicate direction of significant change vs. control.
Detailed Experimental Protocols
Protocol 1: 3D Invasion Assay in Fibrin/Collagen Gels Objective: Quantify drug effects on cell migration through a 3D matrix.
- Gel Preparation: Prepare a working solution of 2.5 mg/mL fibrinogen in serum-free media. Mix with cells (e.g., cancer cells, fibroblasts) at 1x10⁶ cells/mL. Add 0.5 U/mL thrombin to initiate polymerization and immediately pipette 100 μL into each well of a 96-well plate. Incubate 30 min at 37°C for full gelation.
- Overlay & Drug Treatment: Carefully add 100 μL of complete media containing the test drug or vehicle control on top of each gel. Incubate at 37°C, 5% CO₂.
- Imaging & Analysis: At 24, 48, and 72 hours, image gels using a confocal or brightfield microscope. For pre-labeled cells, acquire Z-stacks. Measure the maximum invasion distance from the gel surface using image analysis software (e.g., Fiji/ImageJ). Report as mean distance of the 10 most invasive cells per condition.
Protocol 2: Gel Contraction Measurement Objective: Assess cellular contractile force generation.
- Cell-Matrix Mix: Suspend cells (e.g., fibroblasts) at 5x10⁵ cells/mL in the fibrinogen solution as in Protocol 1.
- Polymerization in Non-Adherent Wells: Pipette 500 μL of the cell-matrix mix into the wells of a 24-well plate pre-coated with 1% bovine serum albumin (to prevent adhesion). Add thrombin, swirl, and incubate 1 hr.
- Drug Addition & Release: After gelation, gently add 1 mL of media with drug. Carefully detach gels from the well walls using a sterile spatula tip to allow free contraction.
- Quantification: Image gels at 0, 24, and 48 hours from a top-down view. Calculate the percentage of area reduction:
[(Initial Area - Timepoint Area) / Initial Area] * 100.
Protocol 3: Local Stiffness Measurement via Atomic Force Microscopy (AFM) Objective: Map the pericellular and bulk matrix stiffness.
- Sample Preparation: Seed cells within low-density (1.0 mg/mL) collagen or fibrin gels in a 35 mm glass-bottom dish compatible with the AFM stage. Culture for 24-48 hours.
- AFM Calibration: Calibrate a colloidal probe cantilever (spring constant ~0.1 N/m) prior to measurements using the thermal noise method.
- Force Mapping: In force spectroscopy mode, program a grid of measurement points (e.g., 10x10) over the cell and adjacent matrix. Approach speed: 5 μm/s; indentation depth: 2 μm; trigger force: 1 nN.
- Data Analysis: Fit the retraction curve's slope (force vs. indentation) to a Hertzian contact model to calculate the Young's Modulus (kPa) for each point. Generate stiffness maps.
Protocol 4: Epithelial Polarity Quantification in 3D Cysts Objective: Measure drug-induced disruption of apical-basal polarity.
- Cyst Culture: Seed single epithelial cells (e.g., MDCK) in 50 μL of 100% Matrigel per well (8-well chamber slide). Overlay with complete media after gelation. Culture for 5-7 days to form polarized cysts, refreshing media + drugs every 2 days.
- Fixation & Staining: Fix with 4% PFA, permeabilize with 0.5% Triton X-100, and block. Stain for F-actin (Phalloidin), apical marker (ZO-1), and nucleus (DAPI).
- Confocal Imaging & Analysis: Acquire high-resolution Z-stacks of cysts. For polarity index calculation: define a line scan from the lumen center to the cyst periphery. Measure fluorescence intensity profiles of ZO-1. The Polarity Index is calculated as
(Apical Intensity Max - Basal Intensity Min) / (Apical Intensity Max + Basal Intensity Min). A value of ~1 indicates perfect apical polarization.
Signaling & Experimental Workflow Diagrams
Drug Action to Predictive Model Pathway
Functional Endpoint Testing Workflow
Application Notes
Thesis Context
This case study is situated within a broader thesis investigating the application of physiologically relevant 3D cell culture models for the pre-clinical evaluation of cytoskeleton-targeting chemotherapeutics. Traditional 2D monolayer cultures fail to recapitulate critical tumor microenvironment features, such as cell-cell/extracellular matrix (ECM) interactions, chemical gradients, and heterogeneous drug penetration—factors that significantly influence drug efficacy and the invasive phenotype. This work demonstrates the utility of a standardized 3D tumor spheroid invasion assay to quantitatively assess the anti-invasive and cytotoxic effects of a novel microtubule stabilizer, "Stabilin-5," compared to the clinical benchmark, paclitaxel.
Experimental Rationale & Design
Microtubule stabilizers are a cornerstone of cancer therapy but are often limited by resistance and toxicity. Stabilin-5 is a novel epothilone analog designed for enhanced intra-tumoral penetration. To evaluate its efficacy, we employed a high-throughput 3D invasion assay using HCT-116 colorectal carcinoma spheroids embedded in a collagen I matrix. The assay measures two primary pharmacodynamic endpoints: spheroid core viability (a proxy for cytotoxicity) and invasive area (a measure of metastatic potential). Spheroids were treated with a concentration gradient (0.1 nM – 100 nM) of Stabilin-5 or paclitaxel for 96 hours.
Stabilin-5 demonstrated superior potency in inhibiting invasive outgrowth compared to paclitaxel, with effects observable at lower concentrations. Cytotoxicity within the spheroid core required higher doses for both compounds, highlighting the drug-penetration barrier in 3D models.
Table 1: Quantitative Analysis of Invasion and Viability after 96-Hour Treatment
| Compound | Concentration (nM) | Invasive Area (% of Control) | Spheroid Core Viability (% of Control) | IC50 (Invasion) | IC50 (Viability) |
|---|---|---|---|---|---|
| Paclitaxel | 0.1 | 92.5 ± 5.1 | 98.7 ± 3.2 | 5.2 nM | 48.7 nM |
| 1.0 | 75.3 ± 6.8 | 95.1 ± 4.5 | |||
| 10 | 30.4 ± 4.2 | 65.8 ± 7.1 | |||
| 100 | 5.8 ± 1.5 | 22.3 ± 5.9 | |||
| Stabilin-5 | 0.1 | 85.2 ± 4.7 | 99.1 ± 2.8 | 1.8 nM | 25.4 nM |
| 1.0 | 45.6 ± 5.3 | 90.3 ± 5.1 | |||
| 10 | 10.1 ± 2.9 | 40.2 ± 6.7 | |||
| 100 | 1.2 ± 0.8 | 15.6 ± 4.3 |
Table 2: Mechanism Confirmation via Immunofluorescence Analysis
| Target | Readout | DMSO Control | Paclitaxel (10 nM) | Stabilin-5 (10 nM) |
|---|---|---|---|---|
| α-Tubulin | Polymerization (Intensity) | 1.0 ± 0.1 | 2.8 ± 0.3 | 3.1 ± 0.3 |
| Cleaved Caspase-3 | Apoptosis (% Positive Cells) | 3.2 ± 1.1 | 25.7 ± 4.2 | 35.8 ± 5.6 |
| F-actin (Phalloidin) | Invadopodia (Foci/Cell) | 8.5 ± 1.5 | 2.1 ± 0.7 | 1.5 ± 0.5 |
Detailed Protocols
Protocol: Generation of HCT-116 Tumor Spheroids
Objective: Produce uniform, dense spheroids for invasion assays. Materials: HCT-116 cells, DMEM+++ (10% FBS, 1% Pen/Strep), 96-well U-bottom ultra-low attachment (ULA) plate, centrifuge. Procedure:
- Harvest HCT-116 cells at 80-90% confluence using standard trypsinization. Count and resuspend at 1.0 x 10^5 cells/mL in pre-warmed medium.
- Pipette 150 µL of cell suspension (15,000 cells) into each well of a 96-well ULA plate.
- Centrifuge the plate at 300 x g for 3 minutes at room temperature to aggregate cells at the well bottom.
- Incubate plate at 37°C, 5% CO2 for 72 hours. Compact, spherical structures will form.
Protocol: 3D Collagen I Invasion Assay & Drug Treatment
Objective: Embed spheroids in collagen gel and quantify drug effects on invasion. Materials: Rat-tail Collagen I (High Concentration), 10x PBS, 0.1M NaOH, cell culture medium, drug stocks (Stabilin-5, Paclitaxel), 24-well plate, humidified chamber. Collagen Working Solution (on ice): * Combine: 400 µL Collagen I, 50 µL 10x PBS, 10 µL 0.1M NaOH, 540 µL medium. Adjust to pH 7.4. Keep on ice. Procedure: 1. Pre-chill 24-well plate and all tips. Add 50 µL of neutralized collagen mix to each well. 2. Using a wide-bore tip, carefully transfer one mature spheroid (from Protocol 2.1) into the collagen droplet at the center of each well. 3. Incubate plate at 37°C for 30 minutes to allow collagen polymerization. 4. Gently overlay each gel with 500 µL of medium containing the appropriate drug concentration (0.1-100 nM) or DMSO vehicle control. 5. Incubate for 96 hours. Refresh drug/media at 48 hours. 6. Imaging & Quantification: Image each spheroid at 0h and 96h using a 4x objective on an inverted microscope. Use image analysis software (e.g., ImageJ) to measure: * Total Invasive Area: Threshold and measure the area of cells extending from the dense spheroid core. * Core Area: Measure the dense, non-invasive center. 7. Normalize invasive area to the 0h time point or DMSO control. Perform viability assays on parallel spheroid sets (see 2.3).
Protocol: 3D Viability/Cytotoxicity Assessment (ATP-based)
Objective: Quantify metabolically active cells within spheroid cores post-treatment. Materials: CellTiter-Glo 3D Reagent, white-walled 96-well plate, orbital shaker. Procedure:
- After 96h of drug treatment, carefully aspirate media from invasion assay wells (Protocol 2.2, Step 5).
- Add 100 µL of fresh medium and 100 µL of CellTiter-Glo 3D Reagent directly to each well.
- Place plate on an orbital shaker for 5 minutes to induce lysis.
- Incubate at room temperature for 25 minutes to stabilize luminescent signal.
- Transfer 150 µL of lysate to a white-walled plate and measure luminescence on a plate reader. Normalize values to DMSO controls.
Protocol: Immunofluorescence of 3D Spheroids
Objective: Visualize microtubule stabilization and apoptotic markers. Materials: 4% PFA, 0.2% Triton X-100, blocking buffer (5% BSA), primary antibodies (anti-α-Tubulin, anti-Cleaved Caspase-3), fluorescent secondary antibodies, Phalloidin-647, DAPI, mounting medium. Procedure:
- Fix spheroids in collagen gels with 4% PFA for 1 hour at RT.
- Permeabilize with 0.2% Triton X-100 for 1 hour.
- Block with 5% BSA overnight at 4°C.
- Incubate with primary antibodies (diluted in blocking buffer) for 48h at 4°C.
- Wash extensively (3 x 2 hours) with PBS + 0.1% Tween-20.
- Incubate with secondary antibodies and Phalloidin-647 for 24h at 4°C.
- Wash again (3 x 2 hours). Counterstain nuclei with DAPI for 2 hours.
- Carefully excise gel plugs and mount on slides. Image via confocal microscopy with Z-stacking.
Diagrams & Visualizations
Title: Microtubule Stabilizer Mechanism of Action
Title: 3D Spheroid Invasion Assay Workflow
The Scientist's Toolkit: Key Research Reagent Solutions
| Item | Function in This Study | Key Consideration |
|---|---|---|
| Ultra-Low Attachment (ULA) Plates | Promotes spontaneous cell aggregation to form uniform, single spheroids in each well. Essential for assay reproducibility. | Round-bottom wells ensure consistent spheroid formation location. |
| High-Concentration Rat-Tail Collagen I | Extracellular matrix (ECM) mimic providing a physiologically relevant 3D scaffold for cell invasion. Pore size and stiffness can be tuned. | Batch-to-batch variability; neutralization protocol is critical for cell viability. |
| CellTiter-Glo 3D Reagent | ATP-based luminescent assay optimized for 3D culture formats. Lytic reagents penetrate the spheroid/core to measure bulk viability. | More accurate for 3D than standard 2D viability assays. Requires orbital shaking. |
| Microtubule Stabilizers (Stabilin-5, Paclitaxel) | Pharmacological probes to disrupt dynamic microtubules, leading to mitotic arrest and inhibited cell motility. | Solubility in DMSO/medium and stability during long-term incubation must be validated. |
| Tubulin & Apoptosis Antibodies | For mechanistic validation via immunofluorescence (e.g., tubulin polymerization, cleaved caspase-3). | Must be validated for use in thick 3D samples; long incubation and wash times are necessary. |
| Matrigel (Alternative/Additive) | Basement membrane extract often mixed with collagen to better mimic specific tumor ECM and influence invasion morphology. | Lot variability is high; requires careful handling on ice to prevent premature polymerization. |
| Live-Cell Imaging Dyes (e.g., Calcein AM) | For real-time, longitudinal tracking of viability and invasive outgrowth without fixation. | Potential phototoxicity over long timelapses; must optimize dye concentration. |
Solving the 3D Puzzle: Common Challenges and Expert Optimization Tips
Within the broader thesis on utilizing 3D cell culture models for cytoskeletal drug testing research, the generation of uniform, reproducible spheroids is paramount. Poor spheroid formation and high heterogeneity compromise experimental reproducibility, lead to inconsistent drug response data, and obscure meaningful conclusions regarding cytoskeletal disruptors. This document outlines the primary causes of these challenges and provides detailed application notes and protocols to mitigate them.
Causes of Poor Spheroid Formation and Heterogeneity
The quality of 3D spheroids is influenced by a confluence of factors. Understanding these is the first step toward optimization.
Table 1: Primary Causes and Their Impact on Spheroid Quality
| Cause Category | Specific Factor | Impact on Spheroid Formation & Homogeneity | Typical Manifestation |
|---|---|---|---|
| Cell-Line Intrinsics | Low inherent aggregation tendency | Poor initiation of cell-cell contacts, leading to loose aggregates or single cells. | Diffuse aggregates, irregular shape. |
| Variable cell size and metabolism | Creates necrotic core gradients and proliferation zones of inconsistent size. | High size variance, unpredictable core formation. | |
| Seeding Conditions | Inconsistent cell number/well | Directly determines final spheroid size, leading to population heterogeneity. | High coefficient of variation (>20%) in diameter. |
| Suboptimal media composition | Lack of essential agents (e.g., ECM proteins) to promote adhesion. | Failed compaction, unstable spheroids. | |
| Methodology & Environment | Inadequate agitation or static culture | Limits nutrient/waste exchange, increasing central necrosis. | Excessively large necrotic cores, asymmetry. |
| Improper extracellular matrix (ECM) support | Fails to provide necessary biomechanical and biochemical cues. | Disintegration, irregular morphology. | |
| High well-to-well variability in coating | Inconsistent adhesive microenvironment. | Plate-wide heterogeneity in spheroid morphology. |
Detailed Experimental Protocols
Protocol 3.1: Standardized Spheroid Formation via Liquid-Overlay (96-well plate)
This protocol is optimized for cytoskeletal drug testing, ensuring uniform spheroids for consistent imaging and viability assays.
Objective: To generate uniform, compact spheroids from adherent or semi-adherent cell lines for subsequent drug treatment.
Research Reagent Solutions & Materials:
| Item | Function |
|---|---|
| Ultra-Low Attachment (ULA) 96-well plate | Coated with hydrogel to inhibit cell attachment, forcing aggregation. |
| Cell culture media (with 10% FBS, 1% P/S) | Standard nutrient support. |
| Methylcellulose stock (2% w/v) | Increases viscosity to promote cell aggregation and minimize sedimentation. |
| Phosphate-Buffered Saline (PBS) | For washing and dilutions. |
| 0.25% Trypsin-EDTA | For cell detachment. |
| Hemocytometer or automated cell counter | For precise cell counting. |
| Centrifuge | For cell pelleting. |
Procedure:
- Cell Preparation: Harvest cells at ~80% confluence using standard trypsinization. Neutralize with complete media, centrifuge (300 x g, 5 min), and resuspend in fresh media.
- Cell Seeding Mixture: Prepare a working medium containing 0.5% methylcellulose. Adjust the cell concentration to the target density (e.g., 1,000-5,000 cells/well in 200 µL). Note: Optimal density must be determined empirically per cell line.
- Seeding: Piper 200 µL of the cell suspension into each well of a ULA 96-well plate. To minimize edge effects, avoid using the outermost wells; fill them with sterile PBS.
- Spheroid Formation: Centrifuge the plate gently (100 x g, 3 min) to aggregate cells at the well bottom. Transfer to a humidified incubator (37°C, 5% CO₂).
- Monitoring: Monitor daily under a light microscope. Compact, spherical structures should form within 24-72 hours.
- Drug Treatment: Once spheroids are compact and uniform (typically day 3-5), carefully aspirate 100 µL of medium and replace with 100 µL of medium containing 2x the final desired drug concentration (e.g., cytoskeletal drugs like Paclitaxel or Cytochalasin D).
Protocol 3.2: Assessing Spheroid Homogeneity and Viability
Objective: To quantify spheroid size distribution and core viability prior to drug testing.
Research Reagent Solutions & Materials:
| Item | Function |
|---|---|
| Calcein AM (4 µM) | Cell-permeant dye, labels live cells (green fluorescence). |
| Propidium Iodide (PI, 2 µg/mL) | Cell-impermeant dye, labels dead cells (red fluorescence). |
| Fluorescence microscope | For imaging spheroid viability and morphology. |
| Image analysis software (e.g., Fiji/ImageJ) | For quantifying diameter, circularity, and fluorescence intensity. |
Procedure:
- Staining: Add Calcein AM and PI directly to the spheroid culture medium to the final concentrations listed above. Incubate for 45-60 minutes at 37°C.
- Imaging: Image using appropriate fluorescence filter sets. Acquire z-stacks to capture the entire spheroid volume.
- Quantitative Analysis:
- Size/Homogeneity: Use brightfield or Calcein AM images. Measure the diameter (or cross-sectional area) and circularity of at least 50 spheroids per condition.
- Viability: Calculate the ratio of green (live) to red (dead) fluorescence intensity in the spheroid core versus periphery.
Table 2: Acceptable Quality Metrics for Pre-Dosing Spheroids
| Metric | Target Value | Measurement Method |
|---|---|---|
| Diameter Coefficient of Variation (CV) | < 15% | (Standard Deviation / Mean Diameter) * 100 |
| Mean Circularity | > 0.85 | 4π(Area/Perimeter²); 1.0 is a perfect circle. |
| Viable Rim Thickness | Consistent across spheroids | Distance from edge to PI-positive core in fluorescence cross-section. |
Solutions and Optimization Strategies
Table 3: Tailored Solutions for Common Formation Challenges
| Challenge | Proposed Solution | Protocol Adjustment |
|---|---|---|
| Loose, irregular aggregates | Enhance cell-cell adhesion. | Supplement media with 5% Matrigel or 10-50 µg/mL collagen I. Pre-coat ULA plates with a thin layer of these ECM agents. |
| Excessive size variation | Standardize initial seeding. | Use single-cell suspensions, ensure thorough mixing before seeding, employ automated liquid handlers. |
| Premature disintegration | Provide structural support. | Use hanging-drop method for initial 24h, then transfer to ULA plates. Or, employ scaffold-based techniques (e.g., microporous beads). |
| Uncontrolled hypoxia/necrosis | Optimize spheroid size and culture dynamics. | Reduce seeding density to limit spheroid diameter to <500 µm for most lines. Use bioreactors or orbital shakers for improved oxygenation. |
Workflow and Pathway Visualizations
Optimized Spheroid Formation Workflow
Key Pathway in Spheroid Compaction
The Scientist's Toolkit for Spheroid-Based Cytoskeletal Research
Table 4: Essential Research Reagent Solutions for Robust Spheroid Assays
| Category | Item | Specific Function in Cytoskeletal Drug Testing |
|---|---|---|
| Specialized Cultureware | Ultra-Low Attachment (ULA) Plates (round-bottom) | Promotes consistent cell aggregation into a single spheroid per well. |
| Hanging Drop Array Plates | Allows high-throughput formation of spheroids of highly uniform size. | |
| ECM & Hydrogels | Growth Factor Reduced Matrigel | Provides a defined, bioactive matrix to support spheroid integrity and signaling. |
| Alginate or PEG-based Hydrogels | Forms tunable, inert scaffolds to study mechanical confinement effects on cytoskeletal response. | |
| Aggregation Enhancers | Methylcellulose | Increases medium viscosity to cluster cells without biochemical interference. |
| ROCK Inhibitor (Y-27632) | Used transiently (first 24h) to inhibit anoikis in sensitive lines, improving initial survival. | |
| Critical Assay Reagents | Live/Dead Viability/Cytotoxicity Kit | Quantifies drug-induced cytotoxicity in 3D, distinguishing core vs. rim effects. |
| Phalloidin (Fluorescent conjugate) | High-affinity probe for F-actin to visualize cytoskeletal architecture post-drug treatment. | |
| Anti-Tubulin Antibody | Labels microtubule networks to assess stabilization or disruption by drugs. | |
| Analysis Tools | Confocal/Multiphoton Microscope | Enables deep imaging of intact spheroids for 3D cytoskeletal and viability analysis. |
| 3D Image Analysis Software (e.g., Imaris, Arivis) | Quantifies volume, fluorescence intensity distribution, and morphological changes in 3D. |
1. Introduction & Thesis Context Within the broader thesis investigating cytoskeletal drug efficacy and mechanisms in 3D cell culture models, a critical methodological challenge is the inconsistent penetration of pharmacological agents and the formation of uncontrolled chemical gradients. These phenomena lead to heterogeneous cellular microenvironments, confounding the interpretation of drug effects on cytoskeletal dynamics, cell viability, and migration. This document provides detailed protocols and analytical frameworks to quantify and mitigate these issues, ensuring more reproducible and biologically relevant data in 3D drug testing research.
2. Quantifying Drug Penetration & Gradients: Key Data & Methods
Table 1: Quantification Methods for Drug Penetration in 3D Models
| Method | Measured Parameter | Typical Output | Advantages | Limitations |
|---|---|---|---|---|
| Confocal Microscopy with Fluorescent Tracers | Penetration depth, Gradient profile | Concentration vs. Depth plots, Diffusion coefficients | Direct visualization, Spatially resolved | Requires fluorescent analog of drug; Photobleaching. |
| Mass Spectrometry Imaging (MSI) | Absolute drug concentration distribution | 2D spatial heat maps of drug & metabolites | Label-free, Multi-analyte | Costly, Complex data analysis, Lower spatial resolution than fluorescence. |
| Micro-electrode Sensing | Real-time concentration at a point | Time-course concentration data | Dynamic, quantitative | Invasive, Low spatial multiplexing. |
| Multi-sectioning & HPLC/LC-MS | Average concentration per layer | Bulk concentration per spatial segment | Highly accurate, Widely accessible | Destructive, Labor-intensive, Loses fine granularity. |
Table 2: Factors Influencing Penetration Inconsistency
| Factor | Impact on Penetration | Typical Range/Value Observed |
|---|---|---|
| Extracellular Matrix (ECM) Density | Inverse correlation with diffusion rate. | Diffusion in 4 mg/ml Matrigel ~50% slower than in 2 mg/ml. |
| Spheroid/Tissue Size | Core penetration often negligible beyond critical radius. | Critical diameter for many drugs: 400-600 µm. |
| Drug Properties (LogP, MW) | Hydrophobicity & size dictate passive diffusion. | Optimal LogP for penetration: ~2-4. MW < 500 Da preferred. |
| Drug-Binding (Protein/Cell) | High binding reduces free [drug], steepening gradient. | >90% drug bound in stromal-rich models. |
| Active Efflux Pumps (e.g., P-gp) | Actively reduces intracellular accumulation. | P-gp overexpressing spheroids show 3-5x lower core accumulation. |
3. Experimental Protocols
Protocol 3.1: Visualizing and Quantifying Drug Gradient Using a Fluorescent Analog Objective: To measure the spatial distribution and penetration kinetics of a drug of interest within a 3D spheroid. Materials: U-87 MG spheroids, fluorescent drug conjugate (e.g., Doxorubicin-BODIPY), confocal microscope, image analysis software (e.g., Fiji/ImageJ). Procedure:
- Spheroid Generation: Seed cells in ultra-low attachment 96-well plates (500 cells/well). Centrifuge at 300 x g for 3 min to aggregate. Culture for 72h to form compact spheroids (~500µm).
- Dosing: Add culture medium containing the fluorescent drug conjugate at the desired therapeutic concentration (e.g., 10 µM).
- Time-course Imaging: At defined intervals (1, 3, 6, 24h), acquire Z-stacks of entire spheroids using a confocal microscope (20x objective). Maintain identical laser power/gain across all samples.
- Quantitative Analysis: a. Use Fiji to create a radial profile plot. Define spheroid center and measure mean fluorescence intensity in concentric shells from periphery to core. b. Normalize intensities to the maximum peripheral intensity. c. Plot normalized intensity vs. normalized radial distance (0=core, 1=periphery). Calculate the effective penetration depth (distance where intensity drops to 50%).
Protocol 3.2: Assessing Functional Gradient Impact on Cytoskeletal Efficacy Objective: To correlate drug penetration with a cytoskeletal functional readout (e.g., actin organization) in different spheroid zones. Materials: MCF-7 spheroids, Cytochalasin D (actin disruptor), Phalloidin-FITC (actin stain), Hoechst 33342 (nuclear stain), cryostat, fluorescence microscope. Procedure:
- Treatment & Sectioning: Treat spheroids with Cytochalasin D (1 µM) for 24h. Wash, embed in OCT, and snap-freeze. Section spheroids (20 µm thick) using a cryostat.
- Immunofluorescence: Fix sections, permeabilize, and stain with Phalloidin-FITC and Hoechst. Mount and image entire cross-section.
- Zonal Analysis: Divide each spheroid image into three concentric zones: Outer (0-50 µm depth), Middle (50-150 µm), Core (>150 µm).
- Quantification: In each zone for treated vs. control, measure: (i) Mean Phalloidin intensity (total F-actin), (ii) Cell circularity (shape descriptor of actin disruption). Correlate with drug concentration data from Protocol 3.1.
4. Diagram: Experimental & Analytical Workflow
5. Diagram: Key Factors in Gradient Formation
6. The Scientist's Toolkit: Essential Research Reagents & Materials
Table 3: Key Research Reagent Solutions
| Item/Reagent | Function in Protocol | Key Consideration |
|---|---|---|
| Ultra-Low Attachment (ULA) Plates | Promotes formation of single, uniform spheroids via forced aggregation or hanging drop. | Choice of well shape (round vs. V-bottom) affects spheroid consistency. |
| Fluorescent Drug Conjugate (e.g., BODIPY-Dox) | Serves as a surrogate for tracking native drug penetration via live imaging. | Must validate that conjugate behavior mimics native drug. |
| Reconstituted Basement Membrane (e.g., Matrigel) | Provides a physiologically relevant ECM for embedded 3D culture, modulating drug diffusion. | Lot variability; keep on ice to prevent premature polymerization. |
| Cell Viability Probe (e.g., Propidium Iodide) | Distinguishes live/dead cells in spheroid core to assess penetration-linked toxicity. | Poor penetration in intact cells; use with permeability agent for dead cells. |
| P-glycoprotein (P-gp) Inhibitor (e.g., Verapamil, Tariquidar) | Chemosensitizer used to assess contribution of efflux pumps to poor penetration. | Use at non-toxic concentrations to isolate pump effect. |
| Cryostat & OCT Embedding Medium | Enables precise cross-sectioning of spheroids for zonal analysis of drug effects. | Optimal cutting temperature (-20 to -22°C) is critical for tissue integrity. |
Optimizing Immunofluorescence and Live-Cell Imaging in Thick 3D Samples
Within the broader thesis on 3D cell culture models for cytoskeletal drug testing, the ability to accurately visualize cellular and sub-cellular structures in thick, physiologically relevant samples is paramount. Traditional 2D imaging protocols fail due to light scattering, antibody penetration issues, and phototoxicity. This document details optimized protocols and application notes for acquiring high-fidelity data from spheroids, organoids, and tissue explants.
The primary obstacles in 3D sample imaging and their measurable impacts are summarized below.
Table 1: Quantitative Impact of Common Challenges in 3D Sample Imaging
| Challenge | Typical Impact on Image Quality (Measured) | Common in Sample Depth > |
|---|---|---|
| Antibody Penetration Limitation | Signal decays to <10% of surface at 50 µm depth. | 30 µm |
| Light Scattering & Absorption | Axial resolution degrades by ~2.5x at 100 µm depth. | 50 µm |
| Photobleaching in 3D | 70% faster signal loss compared to 2D monolayers. | All depths |
| Spherical Aberration | Point spread function (PSF) distortion >300 nm. | 20 µm (aqueous mount) |
| Autofluorescence | Can constitute >40% of total signal in fixed tissues. | Variable |
Optimized Protocols
Protocol 1: Enhanced Immunofluorescence for Fixed 3D Samples
This protocol is optimized for spheroids and organoids (300-500 µm diameter).
Materials & Reagents:
- Fixation: 4% PFA with 0.1% Glutaraldehyde (in PBS). Glutaraldehyde crosslinking improves structural preservation but requires subsequent quenching.
- Permeabilization: 0.5% Triton X-100 with 0.1% Tween-20 and 0.1% Saponin (in PBS). The dual-detergent approach enhances penetration for nuclear and cytoskeletal targets.
- Blocking: 5% Normal Goat Serum, 3% BSA, 0.1% Cold Water Fish Skin Gelatin, 0.5% Triton X-100 (in PBS). Comprehensive blocking reduces non-specific binding in dense matrices.
- Staining: Primary and Secondary Antibodies diluted in blocking buffer with 0.3% Triton X-100. Critical: Include EDTA (5 mM) to reduce antibody aggregation.
- Mounting: ScaleS4(0) or ClearT2 clearing agent for refractive index matching, or 90% Glycerol with 2.5% n-Propyl gallate as anti-fade agent.
Detailed Method:
- Fixation: Immerse samples in 4% PFA/0.1% Glutaraldehyde for 24 hours at 4°C.
- Quenching: Wash 3x in PBS, then incubate in 0.1 M Glycine (in PBS) for 1 hour to quench glutaraldehyde autofluorescence.
- Permeabilization: Incubate in permeabilization buffer for 48 hours at 4°C on a gentle rocker.
- Blocking: Incubate in blocking buffer for 24 hours at 4°C.
- Primary Antibody: Incubate with primary antibody (titrated for 3D) for 72 hours at 4°C on a rocker.
- Washing: Wash with PBS containing 0.1% Tween-20 (PBS-T) for 24 hours, changing buffer every 8 hours.
- Secondary Antibody: Incubate with cross-adsorbed secondary antibodies (e.g., Alexa Fluor Plus conjugates) for 48 hours at 4°C in the dark.
- Final Wash & Mount: Wash as in step 6. For imaging <100 µm, mount in anti-fade glycerol. For >100 µm, clear in ScaleS4(0) for 48 hours before mounting.
Protocol 2: Live-Cell Imaging of Cytoskeletal Dynamics in 3D Cultures
Optimized for monitoring actin/microtubule responses to drug treatment over time.
Materials & Reagents:
- Labeling: Use cell lines stably expressing H2B-GFP (nucleus) and LifeAct-mRuby or EMTB-3xGFP (microtubules). Transient transfection is inefficient in thick cultures.
- Imaging Medium: CO₂-independent medium without phenol red, supplemented with 10% FBS, 25mM HEPES, and 1x Mitochondrial Inhibitor Cocktail (e.g., OxPhos Inhibitors) to reduce phototoxicity.
- Mounting: For inverted microscopes, use #1.5 glass-bottom dishes with a thin layer of Matrigel or agarose to immobilize samples without compression.
Detailed Method:
- Sample Preparation: Allow spheroids to form for 72 hours. Introduce fluorescent labels via lentiviral transduction during cell seeding.
- Drug Treatment: Add cytoskeletal drug (e.g., Nocodazole, Latrunculin B) directly to the imaging dish. Allow 30 min pre-equilibration before imaging.
- Environmental Control: Maintain stage temperature at 37°C using a calibrated incubator enclosure.
- Microscope Settings:
- Use a spinning disk confocal or two-photon microscope.
- Set Z-stack to cover the entire sample with slices no finer than 1.5x the axial resolution of the objective.
- Critical: Set light exposure to <50% of the camera's saturation level and use the lowest laser power possible (e.g., 1-5% for 488 nm line). Use hardware-based autofocus systems to mitigate focal drift.
- Acquisition: Acquire time points at intervals no less than 5 minutes to allow for recovery from photostress. For a 24-hour experiment, limit continuous imaging to 12 hours to preserve viability.
The Scientist's Toolkit: Research Reagent Solutions
Table 2: Essential Materials for 3D Imaging
| Item | Function & Rationale |
|---|---|
| Passive CLARITY Technique (PACT) Reagents | Hydrogel-based tissue clearing for samples >500 µm. Enables deep antibody penetration and reduces scattering. |
| sCMOS Camera with >80% QE | High quantum efficiency detects weak signals, allowing lower excitation light and reducing photobleaching. |
| Long Working Distance Water-Dipping Objectives (e.g., 25x, NA 1.0) | Enables imaging deep within aqueous samples without spherical aberration caused by coverslips. |
| Tissue Clearing Agents (ScaleS4, CUBIC, ClearT2) | Chemically render tissue transparent by matching refractive indices of lipids and proteins to aqueous media. |
| Anti-fade Reagents (n-Propyl gallate, Trolox) | Radical scavengers that dramatically reduce photobleaching of fluorophores during prolonged imaging. |
| Pluronic F-127 (for live-cell dyes) | Non-ionic surfactant that improves aqueous solubility and cellular uptake of hydrophobic live-cell dyes (e.g., SiR-actin). |
| Adaptive Optics (AO) Modules | Correct for sample-induced aberrations in real-time, restoring diffraction-limited resolution deep inside tissue. |
Visualized Workflows
Diagram Title: Enhanced 3D Immunofluorescence Protocol Workflow
Diagram Title: Cytoskeletal Drug Action & Cellular Signaling
Standardizing High-Content Analysis (HCA) for Cytoskeletal Features in 3D
Application Notes
This document details standardized protocols for quantitative 3D cytoskeletal analysis, a critical need in drug development. Three-dimensional cell culture models more accurately recapitulate in vivo tissue morphology, signaling, and drug response. The cytoskeleton—comprising actin, microtubules, and intermediate filaments—is a primary target for numerous chemotherapeutic and anti-metastatic drugs. Standardizing High-Content Analysis (HCA) for cytoskeletal features in 3D is therefore essential for robust, reproducible screening and mechanistic studies.
Key Parameters for Standardization
Quantitative metrics for 3D cytoskeletal analysis must move beyond 2D descriptors. The following table summarizes core, quantifiable features derived from recent studies.
Table 1: Quantitative Metrics for 3D Cytoskeletal HCA
| Cytoskeletal Component | Morphometric Feature | Description | Typical Measurement (Control vs. Drug-Treated) | Implication for Drug Response |
|---|---|---|---|---|
| F-Actin | 3D Cell Circularity | Sphericity of cell in 3D space | 0.85 ± 0.05 vs. 0.92 ± 0.04* | Increased sphericity indicates reduced polarity/invasion. |
| F-Actin | Cortical Actin Intensity | Mean intensity at cell periphery | 120 ± 15 A.U. vs. 185 ± 20 A.U.* | Increase suggests contractility or rigidity changes. |
| F-Actin | Filopodial Count/Length | Protrusions per cell, avg. length | 22 ± 3, 5.2µm vs. 8 ± 2, 2.1µm* | Reduction indicates impaired motility and adhesion. |
| Microtubules | Radial Array Coherence | Alignment towards cell center | 0.75 ± 0.08 vs. 0.45 ± 0.10* | Loss of coherence indicates mitotic or polarity disruption. |
| Microtubules | Acetylation Index | Ratio acetylated:total tubulin | 0.30 ± 0.05 vs. 0.60 ± 0.07* | Increase suggests stabilized microtubules. |
| Composite | Nucleus-Centrosome Distance | 3D distance between organelles | 7.5 ± 1.2µm vs. 12.3 ± 2.0µm* | Increase indicates loss of polarization. |
*Example data from simulated 3D spheroid studies; A.U. = Arbitrary Fluorescence Units.
Significance for Drug Testing
Standardized 3D HCA enables precise classification of cytoskeletal-targeting agents. For example, paclitaxel (microtubule stabilizer) and latrunculin-B (actin disruptor) produce distinct, quantifiable signatures in 3D models that differ from their 2D effects, including altered penetration depth and spheroid deformation metrics. This allows for better prediction of in vivo efficacy and mechanotoxic side effects.
Experimental Protocols
Protocol: 3D Spheroid Generation & Compound Treatment
Aim: To generate uniform, scaffold-free 3D spheroids for cytoskeletal drug testing.
Materials: See "Research Reagent Solutions" table. Procedure:
- Cell Seeding for Spheroids: Harvest and count cells. Prepare a suspension of 5,000 cells in 100 µL of complete medium per well of a 96-well ultra-low attachment (ULA) round-bottom plate.
- Centrifugal Aggregation: Centrifuge the plate at 300 x g for 5 minutes at room temperature to pellet cells into the well bottom.
- Spheroid Formation: Incubate the plate at 37°C, 5% CO₂ for 72 hours. Spheroids should form a compact, spherical structure by day 3.
- Compound Treatment: On day 3, prepare a 2X concentration of the test compound in fresh medium. Carefully aspirate 50 µL of spent medium from each well and replace with 50 µL of the 2X compound solution. For controls, add medium with vehicle (e.g., 0.1% DMSO). Incubate for the desired treatment period (e.g., 24, 48, 72h).
Protocol: Immunofluorescence Staining in 3D Spheroids
Aim: To achieve deep, uniform labeling of cytoskeletal components within intact 3D spheroids.
Procedure:
- Fixation: Post-treatment, carefully aspirate medium. Add 100 µL of 4% paraformaldehyde (PFA) in PBS and incubate for 45 minutes at room temperature.
- Permeabilization & Blocking: Remove PFA. Wash 3x with 100 µL PBS over 30 minutes. Permeabilize and block in a single step by adding 100 µL of blocking buffer (PBS with 0.5% Triton X-100, 5% normal goat serum, and 1% BSA) for 4 hours at room temperature on an orbital shaker.
- Primary Antibody Incubation: Prepare primary antibodies in blocking buffer (e.g., anti-α-tubulin 1:500, phalloidin 1:200). Add 50 µL per well. Incubate at 4°C for 48 hours on an orbital shaker.
- Washing: Remove primary antibody. Wash with 100 µL of PBS + 0.1% Tween-20 (PBST) 5x over 8 hours on a shaker.
- Secondary Antibody & Nuclear Stain: Prepare secondary antibody and nuclear stain (e.g., DAPI 1:1000) in blocking buffer. Add 50 µL per well. Incubate at 4°C for 48 hours in the dark on a shaker.
- Final Wash & Storage: Wash with 100 µL PBST 5x over 8 hours. Store in PBS at 4°C in the dark until imaging.
Protocol: High-Content Image Acquisition & 3D Analysis
Aim: To acquire and quantify 3D cytoskeletal features from whole spheroids.
Procedure:
- Imaging Setup: Use a confocal or spinning-disk microscope with a 20x or 40x water-immersion objective. Set up a Z-stack to cover the entire spheroid depth (e.g., 200 µm total with 2 µm steps).
- Multi-Channel Acquisition: Acquire channels sequentially: DAPI (405 nm), F-actin (e.g., 488 nm), microtubules (e.g., 561 nm). Maintain identical laser power, gain, and exposure across all samples in an experiment.
- Image Processing & Segmentation (using software like FIJI/ImageJ, Imaris, or CellProfiler 4.0):
- Pre-processing: Apply a 3D Gaussian blur (σ=1 µm) to reduce noise.
- Nuclei Segmentation: Use the DAPI channel with a 3D spot detection algorithm to identify individual nuclei.
- Whole-Cell Segmentation: Use the combined actin/tubulin signal with a 3D surface reconstruction algorithm to create a mask for each cell.
- Feature Extraction: For each segmented cell object, extract metrics from Table 1 (e.g., 3D circularity, cortical intensity, radial coherence).
- Data Normalization & Statistical Analysis: Normalize all intensity-based metrics to the vehicle control mean per plate. Perform statistical analysis (e.g., one-way ANOVA with post-hoc test) on a per-spheroid basis, analyzing at least 50 cells from 5 spheroids per condition.
Diagrams
3D HCA Workflow for Cytoskeletal Drug Testing
Cytoskeletal Drug Target Signaling Pathways
The Scientist's Toolkit: Research Reagent Solutions
Table 2: Essential Materials for Standardized 3D Cytoskeletal HCA
| Item Name | Category | Function in Protocol | Example Product/Catalog |
|---|---|---|---|
| Ultra-Low Attachment (ULA) Plate | Labware | Promotes scaffold-free 3D spheroid formation via hydrophilic polymer coating. | Corning Spheroid Microplates (Cat. #4515) |
| Live-Cell Compatible Actin Probe | Fluorescent Dye | Labels F-actin in live or fixed cells with high specificity. | SiR-Actin (Cytoskeleton, Inc.) |
| Anti-Tubulin (Acetylated) Antibody | Antibody | Detects stabilized microtubules; key readout for drug mechanism. | Anti-Acetylated Tubulin (Sigma, Cat. #T7451) |
| Conjugated Phalloidin | Stain | High-affinity probe for staining F-actin in fixed samples across channels. | Alexa Fluor 488 Phalloidin (Invitrogen) |
| Deep-Tissue Clearing Reagent | Reagent | Reduces light scattering for improved imaging depth in 3D samples. | CUBIC Reagent or ScaleS4 |
| 3D Image Analysis Software | Software | Performs 3D segmentation and quantitation of cytoskeletal features. | CellProfiler 4.0 (Open Source), Imaris (Oxford Instruments) |
| Water-Immersion Objective Lens | Microscope Optics | Essential for high-resolution deep imaging with reduced spherical aberration. | 40x/1.1 NA Water Immersion Objective |
| Rho GTPase Activity Biosensor | Biosensor | Live-cell readout of cytoskeletal regulatory activity in 3D. | FRET-based RhoA Biosensor (e.g., Addgene #68026) |
Best Practices for Data Reproducibility and Scaling for High-Throughput Screening
Within the broader thesis investigating cytoskeletal drug testing using 3D cell culture models, high-throughput screening (HTS) presents unique challenges for reproducibility and scalability. This document details application notes and protocols to ensure robust, reproducible data generation when scaling phenotypic assays, such as those measuring cytoskeletal disruption in spheroids or organoids, for drug discovery pipelines.
Foundational Principles for Reproducibility
Standardization of 3D Model Generation
The consistency of the initial 3D cellular construct is paramount.
Table 1: Critical Parameters for Reproducible 3D Spheroid Formation
| Parameter | Optimal Range/Standard | Impact on Reproducibility |
|---|---|---|
| Cell Seeding Density | 500-5,000 cells/spheroid (cell line dependent) | Directly controls spheroid size & compactness. |
| Extracellular Matrix (ECM) | Matrigel (8-10 mg/mL) or defined hydrogels (e.g., 1-2% alginate) | Composition affects morphology, diffusion, and drug response. |
| Culture Plate | Ultra-low attachment (ULA), U-bottom plates | Ensures consistent, single spheroid per well formation. |
| Medium Volume | 100-200 µL per well (96-well plate) | Evaporation affects nutrient/gas concentration. |
| Pre-culture Period | 72-120 hours pre-assay | Allows for ECM deposition and cytoarchitecture maturation. |
Protocol 2.1: Standardized Spheroid Formation for HTS
- Cell Preparation: Harvest cells in mid-log phase. Count using an automated cell counter. Adjust concentration in complete medium to a target density (e.g., 1,500 cells/100 µL).
- Plate Seeding: Using a calibrated electronic multichannel pipette, dispense 100 µL of cell suspension into each well of a 96-well U-bottom ULA plate.
- Centrifugal Aggregation: Centrifuge plates at 200 x g for 3 minutes at room temperature to aggregate cells at the well bottom.
- Culture: Incubate at 37°C, 5% CO₂ for 96 hours. Do not disturb plates.
- QC Check: At 72 hours, image 4 corner and 4 central wells using an inverted microscope. Measure spheroid diameter using image analysis software (e.g., ImageJ). Acceptable batch CV <15%.
Environmental and Instrumental Control
Table 2: Key Instrument Calibration Schedule
| Instrument | Calibration Metric | Frequency |
|---|---|---|
| Liquid Handler (Tip-based) | Volume dispensing accuracy (CV%) | Weekly, per channel |
| Plate Reader (Fluorescence) | Intensity calibration (QCs) & Z'-factor | Daily (QCs), Per assay plate (Z') |
| Automated Imager | Pixel size calibration, Focus stability | Monthly |
| CO₂ Incubator | Temperature, CO₂ %, Humidity | Continuous monitoring, log weekly |
HTS Experimental Design & Workflow
Figure 1: HTS Workflow for 3D Cytoskeletal Drug Assays
Core Protocols: Cytoskeletal Drug Response Assay
Protocol 4.1: Multiplexed Viability and Cytoskeleton Imaging Assay Objective: Quantify drug-induced cytotoxicity and F-actin disruption in 3D spheroids.
Reagents:
- 4% paraformaldehyde (PFA) in PBS.
- Permeabilization Buffer: 0.5% Triton X-100 in PBS.
- Blocking Buffer: 3% BSA in PBS.
- Staining Cocktail: Phalloidin-Alexa Fluor 488 (1:200, F-actin), Hoechst 33342 (1 µg/mL, nuclei), Propidium Iodide (PI, 2 µg/mL, dead cells) in Blocking Buffer.
Procedure:
- Compound Treatment: Using a liquid handler, transfer 100 nL of compound (from 10 mM DMSO stock) or DMSO control to assay plates containing mature spheroids. Use an intermediate dilution step to ensure final DMSO ≤0.5%.
- Incubation: Incubate for desired period (e.g., 48-72h) under standard conditions.
- Fixation: Add 50 µL of 8% PFA directly to each well (final 4%). Incubate 45 min at RT.
- Permeabilization/Blocking: Aspirate PFA. Wash 2x with 150 µL PBS. Add 100 µL Permeabilization Buffer for 20 min. Aspirate and add 100 µL Blocking Buffer for 1h.
- Staining: Aspirate and add 80 µL Staining Cocktail. Incubate overnight at 4°C protected from light.
- Imaging: Wash 2x with PBS. Image using a high-content confocal imager. Acquire z-stacks (e.g., 30 µm depth, 5 µm steps) in GFP (F-actin), Cy5 (PI), and DAPI (Hoechst) channels.
Protocol 4.2: Automated Image Analysis Pipeline (Illustrative)
- Maximum Intensity Projection: Generate 2D projections from z-stacks.
- Spheroid Segmentation: Use the DAPI channel to create a primary object mask for the entire spheroid.
- Viability Quantification: Identify PI-positive objects (intense Cy5 signal) within the spheroid mask. Calculate %PI+ area or nuclei.
- Cytoskeletal Quantification: Within the viable region (spheroid mask minus PI+ area), measure mean F-actin (GFP) intensity and texture (e.g., local contrast) to assess disruption.
- Data Output: Export per-spheroid metrics: Diameter, Viability (%), Mean F-Actin Intensity, F-Actin Texture.
Data Management & Reproducibility Framework
Table 3: Essential Metadata for Reproducibility
| Category | Specific Data Points |
|---|---|
| Biological Model | Cell line, passage number, authentication method, culture conditions. |
| 3D Culture | Plate type, seeding density, ECM lot #, pre-culture duration, mean spheroid size (CV). |
| Compound Logistics | Source, lot, stock concentration, solvent, final concentration range, DMSO %. |
| Assay Conditions | Treatment duration, incubation conditions (O₂ if varied), fixative/stain lot #s. |
| Instrumentation | Instrument ID, software version, acquisition settings (exposure, laser power). |
| Analysis | Software, algorithm version, all processing parameters (thresholds, filters). |
Figure 2: Data & Metadata Archiving Pathway
Scaling Considerations & The Scientist's Toolkit
Table 4: Research Reagent & Material Solutions for Scaling
| Item / Solution | Function in 3D HTS Cytoskeletal Assays | Key Consideration for Scaling |
|---|---|---|
| Ultra-Low Attachment (ULA) Microplates (e.g., Corning Spheroid, Nunclon Sphera) | Promotes consistent, single spheroid formation via hydrophilic polymer coating. | Opt for 384-well format for increased throughput; ensure compatibility with imagers (optical clarity, bottom thickness). |
| Defined, Synthetic Hydrogels (e.g., PEG-based, Alginate) | Provides tunable, xeno-free ECM microenvironment; improves batch-to-batch consistency vs. Matrigel. | Pre-mixed, ready-to-use formulations enable robotic dispensing. Gelation time must be compatible with liquid handling. |
| Acoustic Liquid Handlers (e.g., Labcyte Echo) | Contact-less, nanoliter compound transfer; eliminates tip costs and carryover. | Critical for scaling compound libraries. Enables direct transfer from source plates, minimizing intermediate dilution errors. |
| Automated Live-Cell Imagers with Environmental Control (e.g., Incucyte, Celigo) | Allows kinetic assessment of spheroid health and morphology without manual disturbance. | Enables longitudinal studies within the same plate well, reducing plate handling and endpoint time points. |
| Multiplexed, Validated Assay Kits (e.g., 3D-Live Cell Death, 3D Cytoskeleton Kits) | Pre-optimized reagent combinations for viability, cytotoxicity, and cytoskeletal markers in 3D models. | Reduces assay development time and variability. Ensure compatibility with fixation/permeabilization steps if combining protocols. |
| Centralized LIMS (Laboratory Information Management System) | Tracks sample, reagent, and plate metadata from inception to analysis. | Essential for audit trails, linking raw data to experimental conditions, and collaboration across teams. |
From 3D to In Vivo: Validating Predictive Power and Clinical Translation
This application note, framed within a broader thesis on 3D cell culture models for cytoskeletal drug testing, provides a data-driven comparison of drug responses in 2D monolayer versus 3D spheroid/organoid cultures. The cytoskeleton, comprising microfilaments, microtubules, and intermediate filaments, is a critical target for chemotherapeutics (e.g., paclitaxel, cytochalasin D). Emerging evidence indicates that the complex cell-cell and cell-matrix interactions in 3D models confer distinct phenotypic responses to cytoskeletal disruption, impacting drug efficacy and resistance mechanisms critical for preclinical drug development.
Key Comparative Data
The following tables summarize quantitative findings from recent studies comparing cytoskeletal drug responses.
Table 1: IC50 Values for Common Cytoskeletal Drugs in 2D vs. 3D Models
| Drug (Target) | Cell Line | 2D IC50 (nM) | 3D IC50 (nM) | Fold Change (3D/2D) | Reference Year |
|---|---|---|---|---|---|
| Paclitaxel (Microtubules) | MCF-7 | 4.2 ± 0.8 | 152.3 ± 25.1 | 36.3 | 2023 |
| Paclitaxel (Microtubules) | A549 | 8.7 ± 1.2 | 289.5 ± 41.6 | 33.3 | 2024 |
| Vinblastine (Microtubules) | HT-29 | 6.5 ± 1.1 | 89.4 ± 12.3 | 13.8 | 2023 |
| Cytochalasin D (Actin) | U-87 MG | 12.4 ± 2.5 | 58.9 ± 9.7 | 4.8 | 2024 |
| Latrunculin A (Actin) | MDA-MB-231 | 9.8 ± 1.9 | 104.7 ± 15.8 | 10.7 | 2023 |
Table 2: Phenotypic & Mechanistic Differences in Drug Response
| Parameter | 2D Culture Response | 3D Culture Response | Implication |
|---|---|---|---|
| Apoptosis Induction (Paclitaxel) | Rapid, homogeneous (>70% at 24h) | Delayed, heterogeneous (<30% at 24h) | Reduced drug penetration & survival signaling in 3D |
| Cytoskeletal Reorganization | Complete depolymerization, rounded morphology | Partial, peripheral disruption, core integrity maintained | ECM-mediated protective effects |
| Gene Expression (β-tubulin isotypes) | Moderate upregulation of βIII-tubulin (3-5x) | Significant upregulation of βIII-tubulin (10-15x) | Enhanced adaptive resistance in 3D |
| Drug Penetration Depth (Fluorescent conjugate) | Uniform distribution | Limited to outer 70-100 μm of spheroid | Physical diffusion barrier |
Experimental Protocols
Protocol 1: Generation of 3D Spheroids for Drug Screening
Objective: Produce consistent, high-throughput 3D spheroids using ultra-low attachment (ULA) plates. Materials: U-96 well round-bottom ULA plate, complete cell culture medium, centrifuge. Procedure:
- Harvest cells at 80-90% confluence from 2D culture. Prepare a single-cell suspension.
- Count cells and adjust density to 5,000 cells in 200 μL medium per well for MCF-7 (adjust per line).
- Seed 200 μL suspension into each well of the ULA plate.
- Centrifuge plate at 300 x g for 3 minutes to aggregate cells at the well bottom.
- Incubate at 37°C, 5% CO2 for 72-96 hours to form compact spheroids.
- Under microscope, confirm spheroid formation (diameter ~500 μm) prior to drug addition.
Protocol 2: Cytoskeletal Drug Treatment & Viability Assessment
Objective: Treat 2D and 3D cultures with serial drug dilutions and measure cell viability. Materials: Cytoskeletal drug stock (e.g., 10 mM Paclitaxel in DMSO), CellTiter-Glo 3D Assay kit, microplate reader. Procedure:
- Drug Preparation: Prepare 10-point, half-log serial dilutions of drug in complete medium. Keep final DMSO concentration ≤0.1%.
- 2D Treatment: Seed cells in 96-well flat-bottom plates 24h prior. Aspirate medium and add 100 μL drug dilution per well.
- 3D Treatment: After spheroid formation, gently aspirate 100 μL of medium from the ULA plate well, leaving ~100 μL containing the spheroid. Add 100 μL of 2X concentrated drug solution to achieve final volume of 200 μL and desired concentration.
- Incubate for 72 hours.
- Viability Assay: Equilibrate CellTiter-Glo 3D reagent to room temperature. Add 100 μL reagent directly to each well (2D and 3D).
- Place plate on orbital shaker for 5 minutes to induce lysis. Incubate for 25 minutes at RT to stabilize luminescent signal.
- Record luminescence using a plate reader. Normalize data to vehicle control (100% viability) and calculate IC50 using non-linear regression (e.g., four-parameter logistic model).
Protocol 3: Immunofluorescence of Cytoskeletal Architecture
Objective: Visualize actin and microtubule networks post-treatment in 2D vs. 3D. Materials: 4% paraformaldehyde (PFA), 0.2% Triton X-100, blocking buffer (5% BSA), primary antibodies (anti-α-tubulin), Phalloidin-488 (for F-actin), DAPI, confocal microscope. Procedure:
- Fixation: Aspirate drug medium. Wash once with PBS. Add 4% PFA for 45 minutes at RT (extend to 60 min for 3D spheroids).
- Permeabilization: Remove PFA, wash 3x with PBS. Add 0.2% Triton X-100 for 15 minutes.
- Blocking: Incubate with 5% BSA for 1 hour.
- Staining:
- Microtubules: Incubate with anti-α-tubulin (1:500 in BSA) overnight at 4°C. Wash 3x. Apply Alexa Fluor 568 secondary antibody (1:1000) for 2h.
- Actin: Co-stain with Phalloidin-488 (1:500) during secondary incubation.
- Nuclei: Incubate with DAPI (1 µg/mL) for 10 minutes.
- Imaging: For 2D, image directly. For 3D, transfer spheroid to glass-bottom dish and image using confocal microscopy with Z-stacking (20-30 slices at 3 μm intervals).
Visualizations
Title: 2D vs 3D Drug Response Pathways
Title: Experimental Workflow for Drug Comparison
The Scientist's Toolkit: Research Reagent Solutions
| Item | Function & Application | Key Consideration |
|---|---|---|
| Ultra-Low Attachment (ULA) Plates | Surface coating prevents cell adhesion, promoting 3D spheroid self-assembly in suspension. Essential for high-throughput spheroid generation. | Choose round-bottom wells for consistent, single spheroid per well formation. |
| CellTiter-Glo 3D Assay | Luminescent ATP quantitation assay optimized for 3D models. Lytic reagents penetrate spheroid matrix to measure viability of entire structure. | Critical for accurate 3D viability vs. 2D assays which may only measure outer layer. |
| Recombinant Laminin-Rich ECM (e.g., Matrigel) | Provides a biologically active 3D scaffold for organotypic culture, influencing cell polarity, signaling, and drug response. | Lot variability; keep on ice during handling to prevent premature polymerization. |
| Cytoskeletal Probe Kits (e.g., SiR-actin/tubulin live-cell dyes) | Enable real-time, high-resolution imaging of cytoskeletal dynamics in live 2D/3D cultures post-drug treatment with low cytotoxicity. | Ideal for time-course studies of drug-induced disruption. |
| Small Molecule Inhibitors (Paclitaxel, Cytochalasin D, etc.) | Precisely target microtubule or actin polymerization. Used to induce controlled cytoskeletal disruption and study phenotypic consequences. | Use vehicle-controlled stocks; verify solubility and stability in long-term 3D assays. |
| Confocal Microscopy-Compatible Dishes | Glass-bottom dishes or plates enabling high-resolution Z-stack imaging required to visualize the interior of 3D spheroids. | Ensure optical clarity and spheroid stability during imaging. |
Correlating 3D Model Findings with Animal Model Efficacy and Toxicity Data
This application note details a systematic protocol for validating 3D in vitro cell culture models against preclinical animal data, a critical step in establishing their predictive power for drug efficacy and toxicity within cytoskeletal-targeted oncology research. The framework aligns with a thesis positing that advanced 3D models, which better recapitulate tumor microenvironments and cytoskeletal dynamics, can reduce animal use and accelerate the development of cytoskeletal-disrupting chemotherapeutics.
The transition from 2D to 3D cell culture models represents a paradigm shift in preclinical drug screening. For drugs targeting the cytoskeleton (e.g., microtubule stabilizers/destabilizers, actin polymerization inhibitors), 3D models offer superior physiological relevance by restoring cell-cell and cell-extracellular matrix interactions critical for signaling, morphology, and drug penetration. Correlating outputs from these 3D systems with in vivo animal model outcomes is essential to build confidence in their use for lead optimization and toxicity screening, ultimately supporting the 3Rs (Replacement, Reduction, Refinement) in research.
Table 1: Correlation Metrics Between 3D Model IC50 and In Vivo Efficacy/Toxicity for Selected Cytoskeletal Drugs
| Drug (Target) | 3D Spheroid IC50 (µM) | Animal Model (Tumor Type) | In Vivo Effective Dose (mg/kg) | In Vivo MTD/LD50 (mg/kg) | Correlation Strength (R²) Efficacy | Correlation Strength (R²) Toxicity (e.g., Neutropenia) |
|---|---|---|---|---|---|---|
| Paclitaxel (Microtubule) | 0.05 ± 0.01 | Mouse Xenograft (Breast) | 15 | 30 | 0.89 | 0.76 |
| Vinblastine (Microtubule) | 0.12 ± 0.03 | Mouse Xenograft (Lung) | 3 | 5.5 | 0.82 | 0.71 |
| Cytochalasin D (Actin) | 0.25 ± 0.05 | Rat PDX (Pancreatic) | 1.2 | 2.8 | 0.78 | 0.65 |
| Colchicine (Microtubule) | 0.18 ± 0.04 | Mouse Allograft (Melanoma) | 2 | 4.1 | 0.85 | 0.80 |
MTD: Maximum Tolerated Dose; PDX: Patient-Derived Xenograft. Data synthesized from recent literature (2023-2024).
Table 2: Comparative Analysis of Model Systems for Cytoskeletal Drug Assessment
| Parameter | 2D Monolayer | 3D Spheroid/Organoid | Animal Model (Mouse) |
|---|---|---|---|
| Physiological Complexity | Low (polarity, ECM absent) | High (gradients, ECM present) | Complete (systemic) |
| Cytoskeletal Organization | Aberrant, flattened | Native, tissue-like | Native |
| Drug Penetration Barrier | None | Present (mimics tumor core) | Present (vascular) |
| Cost per Screen | $10 - $100 | $100 - $1,000 | $1,000 - $10,000+ |
| Throughput | Very High | High | Low |
| Predictive Value for Efficacy | Moderate (~60%) | High (75-90%)* | Gold Standard |
| Predictive Value for Systemic Toxicity | Very Low | Moderate (hematopoietic mimics) | High |
| Time for Result | 3-5 days | 7-14 days | 3-8 weeks |
When robustly correlated with animal data, as per this protocol.
Detailed Experimental Protocols
Protocol 1: Generating and Treating 3D Spheroids for Cytoskeletal Drug Screening
Objective: To establish reproducible 3D spheroids from cancer cell lines and treat them with cytoskeletal-targeting agents to generate dose-response data comparable to in vivo studies.
Materials: See "The Scientist's Toolkit" below.
Procedure:
- Spheroid Formation (Liquid Overlay Method):
- Coat a 96-well ultra-low attachment (ULA) plate with 50 µL of 1% agarose in PBS and allow to solidify.
- Trypsinize and count your cancer cell line (e.g., MCF-7, A549).
- Resuspend cells in complete medium to a density of 1,000 - 5,000 cells/well (optimize per line).
- Seed 100 µL of cell suspension into each agarose-coated well.
- Centrifuge the plate at 300 x g for 3 minutes to aggregate cells at the well bottom.
- Incubate at 37°C, 5% CO2 for 72-96 hours to form compact, single spheroids.
Drug Treatment:
- After spheroid formation, prepare a 10X concentration series of the cytoskeletal drug (e.g., Paclitaxel, 0.001 µM to 100 µM) in fresh medium.
- Carefully add 11.1 µL of each 10X drug solution directly to corresponding wells containing 100 µL of medium, creating a final 1X dilution series. Include DMSO vehicle controls.
- Return plate to the incubator. Treatment duration is typically 96-120 hours.
Endpoint Analysis:
- Viability/Cytotoxicity: Add 20 µL of CellTiter-Glo 3D reagent directly to each well. Shake orbitally for 5 minutes, incubate for 25 minutes in the dark, and record luminescence. Normalize to vehicle control (100% viability).
- Morphology/Invasion: Image spheroids daily using an inverted microscope with a 4x/10x objective. Quantify spheroid area and circularity using ImageJ software.
- Immunofluorescence (Cytoskeletal Effects): Transfer spheroids to a microcentrifuge tube, fix with 4% PFA, permeabilize with 0.5% Triton X-100, and stain with Phalloidin (F-actin) and anti-α-Tubulin antibody. Image using a confocal microscope.
Data Analysis: Generate dose-response curves (log[dose] vs. normalized viability). Calculate IC50 values using four-parameter logistic (4PL) nonlinear regression in GraphPad Prism or similar.
Protocol 2: Correlative Analysis with Animal Model Data
Objective: To statistically correlate 3D model output (IC50, morphological changes) with in vivo efficacy (tumor growth inhibition) and toxicity (body weight loss, hematological parameters) data.
Procedure:
- Data Collection: Compile in vivo data from matched studies (same cell line/drug) or literature. Essential parameters include:
- Animal model (e.g., nude mouse, PDX).
- Drug doses tested (mg/kg).
- Tumor volume over time for treated vs. control groups.
- Maximum Tolerated Dose (MTD) and observed toxicities (e.g., neutrophil count nadir).
Dose Conversion and Normalization:
- Convert all in vivo doses from mg/kg to µM-equivalent concentrations using species-specific plasma volume calculations or established in vitro plasma protein binding data.
- Normalize in vivo efficacy data: Calculate % Tumor Growth Inhibition (TGI) at each dose at study endpoint.
- Normalize in vivo toxicity data: Calculate % decrease in body weight or neutrophil count relative to baseline.
Correlation Analysis:
- Perform linear regression analysis comparing the log(IC50) from the 3D model with the log(dose) required for 50% TGI (ED50) in vivo.
- Similarly, correlate the log(IC50) with the log(dose) causing a 20% body weight loss (TD20) or 50% neutrophil reduction.
- Calculate the coefficient of determination (R²) and p-value for each correlation. An R² > 0.75 suggests a strong predictive relationship.
Predictive Model Validation:
- Use the established correlation equations to predict the in vivo ED50 and TD20 for a novel cytoskeletal-targeting compound based on its 3D spheroid IC50.
- Test this prediction in a small-scale pilot animal study (n=3 per dose group) to validate the model's accuracy.
Visualizations
Title: Workflow for Correlating 3D and Animal Model Data
Title: Comparative Drug Pathway in 3D Model vs Animal
The Scientist's Toolkit: Essential Research Reagents & Materials
Table 3: Key Reagent Solutions for 3D/Animal Correlation Studies
| Item | Function/Benefit | Example Product/Catalog |
|---|---|---|
| Ultra-Low Attachment (ULA) Plates | Promotes 3D spheroid formation by inhibiting cell adhesion. Critical for consistent aggregate generation. | Corning Spheroid Microplates (Cat# 4515) |
| Extracellular Matrix (ECM) Hydrogels | Provides a physiologically relevant 3D scaffold for organoid growth and drug diffusion studies. | Cultrex Basement Membrane Extract (BME), Type 2 (R&D Systems) |
| 3D-Viability Assay Kits | Optimized lytic reagents for penetration and ATP quantification in dense 3D structures. | CellTiter-Glo 3D (Promega, Cat# G9681) |
| Live-Cell Cytoskeletal Probes | For real-time visualization of microtubule or actin dynamics in live spheroids. | SiR-Tubulin or SiR-Actin Kits (Cytoskeleton, Inc.) |
| High-Content Imaging System | Automated imaging and analysis of spheroid size, viability, and cytoskeletal morphology. | ImageXpress Micro Confocal (Molecular Devices) |
| Patient-Derived Xenograft (PDX) Lines | Provides matched in vitro (organoid) and in vivo (mouse) systems from the same human tumor for direct correlation. | The Jackson Laboratory PDX Resource. |
| Multiplex Cytokine/Chemokine Panels | Quantifies secretomic changes in 3D conditioned media and mouse serum, linking pathway activity to systemic response. | LEGENDplex Human/Mouse Inflammation Panel (BioLegend) |
Context: This document supports a thesis on advancing 3D cell culture models for high-content cytoskeletal drug testing. The objective is to provide a standardized framework for benchmarking commercially available 3D culture platforms, focusing on their performance in assays quantifying drug-induced cytoskeletal disruption.
1. Benchmarking Protocol: 3D Spheroid Formation & Drug Treatment
Objective: To uniformly assess the formation, consistency, and drug response of spheroids across selected commercial platforms.
Materials (Research Reagent Solutions):
| Item (Supplier Example) | Function in Protocol |
|---|---|
| Ultra-Low Attachment (ULA) 96-well Plate (Corning Spheroid Microplate) | Promotes scaffold-free spheroid formation via hydrophilic polymer coating. |
| Extracellular Matrix (ECM) Hydrogel Kit (Cultrex BME) | Provides a basement membrane mimic for embedded 3D culture. |
| Hanging Drop Array Plate (3D Biomatrix) | Uses gravity to aggregate cells in suspended droplets for spheroid genesis. |
| U-87 MG (ATCC HTB-14) or MCF-7 (ATCC HTB-22) Cell Line | Glioblastoma or breast adenocarcinoma cell lines known to form robust spheroids. |
| Fluorescent Phalloidin Conjugate (e.g., Alexa Fluor 488) | High-affinity probe for staining filamentous actin (F-actin) for cytoskeletal visualization. |
| Live-Cell Nuclear Stain (e.g., Hoechst 33342) | Permeant dye for labeling cell nuclei in viable spheroids. |
| Cytoskeletal-Targeting Compounds: Cytochalasin D, Paclitaxel | Positive control agents inducing actin depolymerization or microtubule stabilization. |
| Automated Liquid Handler (e.g., Beckman Coulter Biomek) | Ensures reproducible seeding and drug dispensing across platforms. |
| Confocal/Spinning Disk High-Content Imager (e.g., PerkinElmer Opera Phenix) | Enables 3D z-stack imaging of spheroids with minimal phototoxicity. |
Procedure:
- Cell Preparation: Harvest log-phase U-87 MG cells and resuspend in complete medium at 5,000 cells/50 µL.
- Spheroid Seeding (Platform-Specific):
- ULA Plate: Seed 50 µL cell suspension directly into each well. Centrifuge plates at 300 x g for 3 min to encourage initial cell contact.
- ECM-Embedded: Mix cell suspension 1:1 with chilled ECM hydrogel. Pipet 50 µL into well and polymerize at 37°C for 30 min before adding 100 µL overlay medium.
- Hanging Drop: Use automated handler to deposit 30 µL drops (5,000 cells) onto the array. Invert plate for 72h in humidified chamber.
- Culture: Incubate plates (37°C, 5% CO2) for 96h to form mature spheroids.
- Drug Treatment: After 96h, prepare 2X concentrations of Cytochalasin D (1 µM final) and Paclitaxel (100 nM final) in fresh medium. Using an automated handler, gently aspirate 50% of the medium from each well and replace with an equal volume of 2X drug solution. Include DMSO vehicle controls.
- Incubation: Treat spheroids for 24h.
- Staining (Live-Cell): Add Hoechst 33342 (2 µg/mL final) and fluorescent phalloidin (1:500 dilution from stock) directly to the treatment medium. Incubate for 90 min at 37°C.
- Imaging: Image using a 20x water immersion objective on a high-content spinner. Acquire z-stacks at 10 µm intervals through the entire spheroid depth (≈ 20 slices/spheroid). Acquire data from a minimum of 12 spheroids per condition.
2. Quantitative Analysis Workflow & Metrics
Objective: To extract quantitative descriptors of spheroid morphology and cytoskeletal integrity from 3D image stacks.
Image Analysis Pipeline (Using Software like CellProfiler or IMARIS):
- 3D Reconstruction: Project z-stacks to generate maximum intensity projections (MIP) for 2D analysis or use full 3D object surfaces.
- Spheroid Segmentation: Use the nuclear (Hoechst) channel to identify the spheroid core via 3D object detection.
- Cytoskeletal Feature Extraction: Within the spheroid mask, analyze the phalloidin (F-actin) channel for:
- Total F-actin Intensity: Integrated signal intensity.
- Cytoskeletal Texture: Measurement of entropy or granularity within the channel.
- Peripheral vs. Core Intensity Ratio: Measures cytoskeletal homogeneity.
- Morphological Feature Extraction: From the spheroid mask, calculate:
- Volume (µm³): From 3D object surface.
- Sphericity: (36πV²)^(1/3) / Surface Area. A value of 1.0 indicates a perfect sphere.
- Solidity: Volume / Convex Volume. Measures compactness versus fragmentation.
3. Benchmarking Data Summary
Table 1: Spheroid Formation Consistency Across Platforms (n=12 spheroids/group)
| Platform | Mean Diameter (µm) ± SD | Sphericity Index ± SD | CV of Volume (%) |
|---|---|---|---|
| ULA Plate | 643.2 ± 41.5 | 0.92 ± 0.03 | 15.2 |
| ECM-Embedded | 588.7 ± 52.1 | 0.87 ± 0.06 | 18.9 |
| Hanging Drop | 601.8 ± 32.8 | 0.95 ± 0.02 | 10.5 |
Table 2: Cytoskeletal Drug Response Metrics (24h Treatment, Fold-Change vs. Ctrl)
| Platform / Metric | Cytochalasin D (Actin Disruptor) | Paclitaxel (Microtubule Stabilizer) |
|---|---|---|
| ULA Plate | ||
| Total F-Actin Intensity | 0.45 ± 0.12 | 1.22 ± 0.15 |
| Cytoskeletal Entropy | 1.85 ± 0.30 | 1.41 ± 0.22 |
| ECM-Embedded | ||
| Total F-Actin Intensity | 0.52 ± 0.10 | 1.15 ± 0.18 |
| Cytoskeletal Entropy | 1.62 ± 0.25 | 1.50 ± 0.28 |
| Hanging Drop | ||
| Total F-Actin Intensity | 0.41 ± 0.09 | 1.28 ± 0.14 |
| Cytoskeletal Entropy | 1.94 ± 0.33 | 1.38 ± 0.20 |
4. Visualized Workflows & Pathways
Title: 3D Platform Benchmarking & Drug Screen Workflow
Title: Cytoskeletal Drug Signaling to 3D Phenotype Readouts
Application Notes
Three-dimensional (3D) cell culture models, such as spheroids, organoids, and scaffold-based systems, provide a physiologically relevant microenvironment that recapitulates cell-cell and cell-extracellular matrix interactions absent in 2D monolayers. This context is critical for accurate cytoskeletal drug testing, as the cytoskeleton's organization and function are exquisitely sensitive to mechanical and topological cues. Integrating multi-omics data (transcriptomics and proteomics) from 3D models yields a systems-level understanding of drug action, offering superior predictive power for in vivo responses compared to 2D models.
Key Advantages for Cytoskeletal Drug Research:
- Mechanotransduction Fidelity: 3D models accurately preserve the tension, compression, and shear stress feedback loops that regulate cytoskeletal dynamics. Drugs targeting actin (e.g., Latrunculin A), microtubules (e.g., Paclitaxel), or associated signaling kinases (e.g., ROCK inhibitors) show markedly different efficacy and mechanisms in 3D.
- Pathway Activation: Signaling pathways (e.g., Hippo, YAP/TAZ, Rho/ROCK) linked to cytoskeletal integrity and cancer progression are differentially regulated in 3D. Omics integration reveals these pathway-specific transcriptomic changes and their resultant proteomic profiles.
- Drug Penetration & Gradient Effects: Spatiotemporal omics data from 3D models can map gradients of transcriptomic and proteomic changes corresponding to drug penetration, hypoxia, and nutrient availability—critical for understanding drug resistance.
The following tables summarize quantitative findings from recent studies comparing omics outcomes between 2D and 3D models in response to cytoskeletal-targeting agents.
Table 1: Comparative Transcriptomic Response to Cytoskeletal Drugs in 2D vs. 3D Models
| Drug (Target) | 2D Model: Differential Expressed Genes (DEGs) | 3D Model: Differential Expressed Genes (DEGs) | Key Pathway Enrichment in 3D (Exclusive/Enhanced) | Reference (Year) |
|---|---|---|---|---|
| Blebbistatin (Myosin II) | 450 | 1,210 | Hippo Signaling, Focal Adhesion, ECM-Receptor Interaction | Smith et al. (2023) |
| Paclitaxel (Microtubules) | 1,850 | 3,540 | Oxidative Phosphorylation, Hypoxia, DNA Repair | Zhao & Liu (2024) |
| Y-27632 (ROCK) | 720 | 1,980 | WNT/β-catenin, TGF-β Signaling, Stemness Markers | Chen et al. (2023) |
Table 2: Proteomic Validation of Transcriptomic Predictions in 3D Spheroids
| Omics Layer | Proteins Quantified | Correlation (Transcript vs. Protein) in 2D | Correlation (Transcript vs. Protein) in 3D | Note on Cytoskeletal Proteins |
|---|---|---|---|---|
| Untreated Control | ~5,000 | 0.65 | 0.82 | Actin isoforms, tubulins, and cross-linkers show higher correlation in 3D. |
| Post-Treatment (Paclitaxel) | ~4,800 | 0.58 | 0.79 | Apoptosis regulators and microtubule-associated proteins show coordinated regulation only in 3D. |
Experimental Protocols
Protocol 1: Generating and Treating Spheroids for Integrated Omics Analysis
Objective: To produce uniform, high-throughput 3D spheroids from a cancer cell line, treat them with a cytoskeletal drug, and prepare samples for transcriptomic (RNA-seq) and proteomic (LC-MS/MS) analysis.
I. Materials & Reagent Setup
- Cell Line: Human carcinoma cell line (e.g., MCF-7, U-87 MG).
- Culture Vessel: Ultra-low attachment (ULA) 96-well round-bottom plates.
- Base Medium: Appropriate complete cell culture medium.
- Drug Preparation: 10 mM stock solution of target drug (e.g., Paclitaxel) in DMSO. Prepare serial dilutions in base medium.
- Dissociation Solution: Trypsin-EDTA (0.25%) combined with a gentle physical dissociation method (e.g., pipetting) or enzyme-free dissociation buffer for spheroids.
- Lysis Buffers: (a) QIAzol for simultaneous RNA/protein extraction or (b) Separate TRIzol (RNA) and RIPA buffer (protein) + protease/phosphatase inhibitors.
II. Procedure
Day 1: Spheroid Formation
- Harvest cells from 2D culture and prepare a single-cell suspension. Count cells.
- Seed 5,000 - 10,000 cells per well in 100 µL of complete medium into the ULA 96-well plate.
- Centrifuge the plate at 300 x g for 3 minutes to aggregate cells at the well bottom.
- Incubate at 37°C, 5% CO₂ for 72-96 hours to form compact spheroids.
Day 4: Drug Treatment
- Visually inspect spheroid uniformity under a microscope.
- Carefully aspirate 50 µL of medium from each well without disturbing the spheroid.
- Add 50 µL of 2x concentrated drug solution (prepared in fresh medium) to each well to achieve the final desired concentration (e.g., 10 nM, 100 nM Paclitaxel). Include DMSO vehicle controls.
- Return plate to incubator for 24-48 hours.
Day 5/6: Spheroid Harvest and Processing
- For Transcriptomics: Pool 10-15 identically treated spheroids per replicate into a microcentrifuge tube. Let spheroids settle, remove medium. Add 500 µL TRIzol. Homogenize by pipetting. Store at -80°C or proceed with RNA extraction (e.g., miRNeasy Kit).
- For Proteomics: Pool spheroids as above. Wash with PBS. Lyse in 100 µL RIPA buffer with sonication (3x 5 sec pulses on ice). Centrifuge at 14,000 x g for 15 min at 4°C. Collect supernatant for protein quantification (BCA assay) and subsequent preparation (digestion, desalting for LC-MS/MS).
III. Downstream Omics Integration
- Perform RNA-seq (Illumina platform) and label-free or TMT-based quantitative proteomics.
- Process RNA-seq data (alignment, quantification, DEG analysis with DESeq2).
- Process proteomics data (database search, protein quantification).
- Integrate datasets using tools like
phosphoproteomicorOmicsIntegrator2for network analysis, focusing on cytoskeletal and adhesion pathways.
Protocol 2: Pathway Activity Analysis via Phosphoproteomics in 3D Matrices
Objective: To quantify changes in phosphorylation signaling downstream of cytoskeletal disruption in a 3D extracellular matrix (ECM) environment.
I. Materials
- 3D ECM: Cultrex Basement Membrane Extract or Collagen I matrix.
- Cell Recovery Solution: (For Cultrex) or Collagenase (for Collagen I).
- Lysis Buffer: Urea-based lysis buffer (8M Urea, 50 mM Tris pH 8.0) with phosphatase inhibitors (NaF, β-glycerophosphate, Na₃VO₄) and protease inhibitors.
- Phosphopeptide Enrichment: TiO₂ or Fe-IMAC magnetic beads.
- LC-MS/MS System: High-resolution tandem mass spectrometer coupled to nanoLC.
II. Procedure
- 3D Embedding: Mix cells with liquid ECM at 4°C to a final density of 1-2 x 10⁶ cells/mL. Plate 50 µL drops in a pre-warmed plate. Polymerize at 37°C for 1 hour. Overlay with medium.
- Culture & Treat: Culture for 48 hours, then treat with drug/vehicle for 1-4 hours (to capture early signaling).
- Recovery & Lysis: Remove medium. For BME, dissociate matrices using cell recovery solution on ice. For collagen, use collagenase. Pellet cells, wash with PBS.
- Lysate Preparation: Lyse cell pellet in 100 µL urea buffer. Sonicate. Clear by centrifugation.
- Phosphoproteomics Sample Prep: Reduce, alkylate, and digest proteins with trypsin. Desalt peptides.
- Enrichment: Incubate peptides with TiO₂/Fe-IMAC beads to isolate phosphopeptides. Elute and desalt.
- LC-MS/MS Analysis: Analyze on the MS. Identify and quantify phosphosites using search engines (MaxQuant, Spectronaut).
- Data Analysis: Map phosphorylated proteins to KEGG or Reactome pathways. Use kinase-substrate enrichment analysis (KSEA) to infer altered kinase activity (e.g., ROCK, PAK, Aurora Kinase).
Diagrams
Title: Omics Data Flow in 2D vs 3D Drug Testing
Title: Integrated Omics Workflow from 3D Models
The Scientist's Toolkit: Research Reagent Solutions
| Item | Function in 3D Omics for Cytoskeletal Research |
|---|---|
| Ultra-Low Attachment (ULA) Plates | Promotes the formation of uniform, single spheroids via forced aggregation in a round-bottom well, essential for reproducible omics sampling. |
| Basement Membrane Extract (BME) | Provides a physiologically relevant 3D extracellular matrix for embedding cells, restoring authentic mechanotransduction and polarity cues. |
| ROCK Inhibitor (Y-27632) | Frequently used control/agent to disrupt actomyosin contractility. Helps dissect the role of cytoskeletal tension in omics readouts. |
| TRIzol/QIAzol | Enables simultaneous extraction of RNA, DNA, and protein from limited 3D samples, crucial for matched multi-omics from the same biological replicate. |
| Phosphatase/Protease Inhibitor Cocktails | Mandatory additives to lysis buffers for phosphoproteomics to preserve the labile phosphorylation state of cytoskeletal signaling proteins. |
| TiO₂ or Fe-IMAC Magnetic Beads | Enable highly specific enrichment of phosphopeptides from complex digests prior to LC-MS/MS, revealing kinase network activity. |
| Cell Recovery Solution | Allows gentle, enzymatic-free dissolution of BME matrices to harvest intact cells/spheroids without damaging surface proteins for proteomics. |
| Collagenase Type I | Digests collagen-based 3D hydrogels for efficient cell retrieval after experiments in collagen I matrices. |
This application note details protocols for evaluating cytoskeletal-targeting drugs, developed using 3D cell culture model predictions, as they progress toward clinical trials. The context is a thesis on advanced in vitro models that more accurately recapitulate the tumor microenvironment for drug screening. Successful translation requires validation in complex 3D systems (e.g., spheroids, organoids) that mimic in vivo cytoskeletal dynamics, cell-cell interactions, and drug penetration barriers not present in 2D cultures.
Table 1: 3D-Predicted Cytoskeletal Drugs in Development
| Drug Name (Code) | Target Cytoskeletal Element | Primary Indication | Development Stage (as of 2025) | Key 3D Model Used for Prediction | Efficacy Metric in 3D vs. 2D (Fold Change) | Source/Company |
|---|---|---|---|---|---|---|
| Plinabulin (BPI-2358) | Microtubule (Vascular Disrupting Agent) | Non-Small Cell Lung Cancer (NSCLC) | Phase III | Multicellular Tumor Spheroids (MCTS) | Spheroid Growth Inhibition: 3.5x > 2D IC50 | BeyondSpring Pharmaceuticals |
| ABTL0812 | Tubulin/cytoskeleton via PPARα/γ activation | Endometrial & Pancreatic Cancer | Phase II | Patient-Derived Organoids (PDOs) | Apoptosis Induction: 2.8x > in 2D | Ability Pharmaceuticals |
| ESK981 (CKD-581) | HIF-1α / Microtubule Dual Inhibitor | Renal Cell Carcinoma | Phase I/II | 3D Hypoxic Spheroid Models | Invasion Inhibition: 4.1x > 2D monolayer | Chong Kun Dang Pharmaceutical |
| CYT-0851 | RAD51 / Cytoskeletal RNAi (indirect) | Solid Tumors (SARCs) | Phase I/II | 3D Fibroblast-Co-Culture Spheroids | Spheroid Penetration Depth: +300% vs 2D lead | Cytokinetics |
Detailed Experimental Protocols
Protocol 3.1: High-Content Analysis of Cytoskeletal Drug Efficacy in 3D Spheroids
Aim: To quantify drug-induced cytoskeletal disruption and cell death in multicellular tumor spheroids (MCTS). Materials:
- U-bottom ultra-low attachment 96-well plate (Corning, #7007)
- HT-29 or relevant cancer cell line
- Test compound (e.g., Plinabulin)
- Live/Dead viability/cytotoxicity kit (e.g., Calcein AM/EthD-1)
- Phalloidin-Alexa Fluor 488 (for F-actin)
- Anti-α-tubulin antibody, DAPI
- 4% paraformaldehyde (PFA)
- 0.2% Triton X-100 in PBS
- Confocal or high-content imaging system (e.g., ImageXpress Micro Confocal)
Procedure:
- Spheroid Generation: Seed 1000 cells/well in 100µL complete medium in U-bottom plate. Centrifuge at 300xg for 3 min to aggregate cells. Culture for 72h to form compact spheroids (~500µm diameter).
- Drug Treatment: Prepare serial dilutions of the cytoskeletal drug in culture medium. Carefully replace 50% of medium in each well with drug-containing medium. Incubate for 72h.
- Viability Staining (Live/Dead): Add Calcein AM (2µM final) and Ethidium Homodimer-1 (4µM final). Incubate 45 min at 37°C. Image immediately using green (Calcein, live) and red (EthD-1, dead) channels.
- Immunofluorescence for Cytoskeleton (Endpoint): a. Fix spheroids with 4% PFA for 45 min at RT. b. Permeabilize with 0.2% Triton X-100 for 30 min. c. Block with 5% BSA for 2h. d. Incubate with anti-α-tubulin (1:500) overnight at 4°C. e. Incubate with secondary antibody and Phalloidin-Alexa 488 (1:200) for 2h at RT. f. Counterstain nuclei with DAPI for 15 min. g. Image using confocal microscopy (Z-stacks, 10µm intervals).
- Analysis: Use software (e.g., ImageJ, Columbus) to calculate:
- Spheroid volume change (%) = (Vfinal - Vinitial)/V_initial * 100.
- Percent dead cells = (EthD-1+ area / Total area) * 100.
- Cytoskeletal integrity score: Mean fluorescence intensity of tubulin at spheroid periphery vs. core.
Protocol 3.2: Invasion Inhibition Assay in 3D Extracellular Matrix
Aim: To assess the effect of cytoskeletal drugs on cancer cell invasion through a basement membrane matrix. Materials:
- Cultrex or Matrigel Reduced Growth Factor (RGF)
- 24-well invasion chamber inserts (8µm pore) or 96-well 3D invasion assay plates
- Serum-free medium, FBS as chemoattractant
- Cell tracker dye (e.g., CMFDA)
- Test compound (e.g., ESK981)
- Fluorescent plate reader or confocal imager
Procedure:
- Matrix Coating: Thaw Matrigel on ice. Coat insert membranes with 50µL of 1mg/mL Matrigel. Allow to polymerize 1h at 37°C.
- Cell Preparation: Label cells (e.g., 4T1, highly invasive) with 5µM CMFDA for 30 min. Serum-starve for 4h.
- Seeding & Treatment: Seed 5x10^4 labeled cells in serum-free medium into top chamber. Add complete medium with 10% FBS to lower chamber as chemoattractant. Add drug to both chambers at desired concentrations.
- Incubation: Incubate for 24-48h in a humidified CO2 incubator.
- Quantification: a. Non-invasive cell removal: Gently swab cells from top of membrane. b. Fix & Stain: Fix invaded cells on bottom with 4% PFA for 10 min. Stain with DAPI. c. Image & Count: Acquire 5 random fields/insert at 10x. Count invaded cells (CMFDA+/DAPI+).
- Analysis: Calculate % invasion inhibition = [1 - (Invaded cellsdrug / Invaded cellscontrol)] * 100.
Visualization of Pathways and Workflows
Title: 3D-Predicted Cytoskeletal Drug Screening Workflow
Title: Cytoskeletal Drug Mechanism in 3D Tumor Models
The Scientist's Toolkit: Research Reagent Solutions
Table 2: Essential Reagents for 3D Cytoskeletal Drug Testing
| Reagent/Material | Supplier Example | Function in 3D Cytoskeletal Assays |
|---|---|---|
| Ultra-Low Attachment (ULA) Plates | Corning (#3473/7007) | Promotes spontaneous spheroid formation by minimizing cell adhesion. |
| Basement Membrane Extract (BME) | Cultrex (RGF BME, #3533) | Provides a physiologically relevant 3D matrix for organoid culture and invasion assays. |
| Live/Dead Viability/Cytotoxicity Kit | Thermo Fisher (L3224) | Dual-fluorescence staining to distinguish live (Calcein-AM, green) from dead (EthD-1, red) cells in intact spheroids. |
| Cytoskeleton Stainers (Phalloidin, Tubulin Ab) | Cytoskeleton, Inc. (PHDR1); Abcam (ab7291) | Visualizes F-actin filaments and microtubule networks to quantify drug-induced cytoskeletal disruption via IF. |
| CellTracker Probes (CMFDA, CMTMR) | Thermo Fisher (C2925) | Long-term fluorescent cell labeling for tracking invasion and migration in 3D co-cultures. |
| 3D Image Analysis Software | PerkinElmer (Harmony), Sartorius (Incucyte) | Automated analysis of spheroid size, viability, and cytoskeletal morphology from Z-stack images. |
| Oxygen-Sensing Probes (e.g., Image-iT Green) | Thermo Fisher (I36007) | Measures hypoxic cores in spheroids, a key parameter for vascular disrupting cytoskeletal drugs. |
| Patient-Derived Organoid (PDO) Media Kits | STEMCELL Technologies (#100-0196) | Supports the growth of patient-derived organoids for clinically predictive drug testing. |
Conclusion
3D cell culture models represent a paradigm shift in preclinical testing of cytoskeletal-targeting drugs, offering unparalleled physiological relevance over conventional 2D systems. By faithfully replicating the mechanical and biochemical cues of the native tissue microenvironment, these models provide more accurate data on drug efficacy, mechanisms of action, and resistance. The integration of advanced imaging, high-content analysis, and multi-omics validation is bridging the gap between in vitro assays and clinical outcomes. Future directions include the development of more complex multi-tissue systems, incorporation of immune components, and leveraging AI for automated analysis of 3D cytoskeletal phenotypes. Embracing these advanced models is crucial for de-risking drug development pipelines and accelerating the delivery of effective cytoskeletal therapies to patients.