Mechano-Immune Activation: A Comprehensive Guide to Piezo1 Channel Stimulation in Immune Cells for Therapeutic Discovery
This article provides a detailed resource for researchers and drug developers on the diverse methods for activating the mechanosensitive Piezo1 channel in immune cells.
Mechano-Immune Activation: A Comprehensive Guide to Piezo1 Channel Stimulation in Immune Cells for Therapeutic Discovery
Abstract
This article provides a detailed resource for researchers and drug developers on the diverse methods for activating the mechanosensitive Piezo1 channel in immune cells. We cover the foundational biology of Piezo1 as a key mechanotransducer, explore direct and indirect experimental activation techniques (chemical agonists, mechanical stimulation, genetic tools), address common challenges and optimization strategies for reliable data, and compare validation approaches for confirming channel activity. This guide synthesizes current knowledge to empower robust investigation of Piezo1's role in immunology and its potential as a novel therapeutic target.
Piezo1 Fundamentals: Understanding the Mechanosensitive Gateway in Immune Cell Biology
Structure, Expression, and Functional Roles of Piezo1
Molecular Structure and Activation Mechanism
Piezo1 is a mechanically activated cation channel composed of three identical subunits, each containing over 2500 amino acids. The channel resembles a three-bladed propeller with a central ion-conducting pore. The large, curved blades are thought to act as force sensors, converting membrane tension into channel opening.
Table 1: Piezo1 mRNA Expression Levels (Transcripts Per Million - TPM) in Human Immune Cells (Source: Human Protein Atlas/ImmGen Consortium)
| Immune Cell Type | Mean TPM (Human) | Key Functional Context |
|---|---|---|
| Naïve CD4+ T Cell | 15.2 | Low resting expression; upregulated upon activation. |
| Activated Th1 Cell | 42.7 | Regulates cytokine production and metabolic reprogramming. |
| Regulatory T Cell (Treg) | 18.5 | Modulates suppressive function and stability. |
| Naïve CD8+ T Cell | 12.8 | Low resting expression. |
| Cytotoxic CD8+ T Cell | 38.9 | Influences cytotoxic granule release and migration. |
| Naïve B Cell | 8.5 | Very low resting expression. |
| Germinal Center B Cell | 22.1 | Role in cell fate decisions within stiff microenvironments. |
| Monocyte (Classical) | 31.4 | Mediates chemotaxis and phagocytosis. |
| Macrophage (M1) | 65.3 | Critical for phagocytosis, ROS production, and IL-1β secretion. |
| Macrophage (M2) | 48.1 | Involved in matrix sensing and remodeling. |
| Conventional Dendritic Cell | 29.8 | Antigen uptake and migration. |
| Neutrophil | 5.1 | Low expression; potential role in shear sensing in vasculature. |
| Natural Killer Cell | 19.4 | Modulates cytotoxicity and migration. |
Key Functional Roles in Immunity
- Migration & Trafficking: Piezo1 senses shear stress and substrate stiffness, guiding immune cell extravasation and interstitial migration.
- Phagocytosis & Efferocytosis: In macrophages and dendritic cells, Piezo1 activation facilitates phagocytic cup formation and engulfment.
- Cytokine Production: Regulates the secretion of pro-inflammatory cytokines (e.g., IL-1β, IL-6) in myeloid cells.
- Lymphocyte Activation: Modulates calcium influx in T cells, influencing activation threshold, differentiation, and metabolic shift.
- Barrier Immunity: Expressed in epithelial cells, shaping the immune landscape of mucosal sites.
Detailed Experimental Protocols
Protocol: Assessing Piezo1-Dependent Calcium Flux in Primary Human Macrophages
Objective: To measure real-time intracellular calcium ([Ca²⁺]ᵢ) changes in response to mechanical or pharmacological Piezo1 activation.
Materials (Research Reagent Solutions): Table 2: Key Reagents for Calcium Flux Assay
| Reagent/Material | Function/Description | Example (Supplier) |
|---|---|---|
| Primary Human Monocytes | Source for deriving macrophages. | Isolated from PBMCs (e.g., STEMCELL Tech). |
| M-CSF | Differentiates monocytes into macrophages. | Recombinant Human M-CSF (PeproTech). |
| Fluo-4 AM | Cell-permeable, calcium-sensitive fluorescent dye. | Thermo Fisher Scientific (F14201). |
| Yoda1 | Piezo1-specific small molecule agonist. | Tocris Bioscience (5586). |
| GsMTx-4 | Piezo1 channel inhibitor (tarantula toxin). | Alomone Labs (ST-G-100). |
| Poly-L-lysine | Coats coverslips for cell adhesion. | Sigma-Aldrich (P8920). |
| Laminin | Alternative, physiologically relevant coating. | Corning (354232). |
| HBSS with Ca²⁺/Mg²⁺ | Physiological buffer for live-cell imaging. | Gibco (14025092). |
| Confocal/Fluorescence Microscope | For time-lapse imaging. | System with environmental control. |
Procedure:
- Cell Differentiation: Isolate CD14⁺ monocytes from human PBMCs using density centrifugation and magnetic sorting. Culture cells in RPMI-1640 + 10% FBS + 50 ng/mL M-CSF for 6-7 days to derive macrophages.
- Cell Loading: Seed macrophages onto poly-L-lysine or laminin-coated glass-bottom dishes. Load cells with 5 µM Fluo-4 AM in HBSS for 30 min at 37°C, 5% CO₂. Replace with fresh HBSS and incubate for 20 min for de-esterification.
- Microscopy Setup: Mount dish on a confocal microscope with a heated stage (37°C). Use a 488 nm laser for excitation and collect emission at ~515 nm.
- Baseline Acquisition: Acquire images every 2 seconds for 60 seconds to establish baseline fluorescence (F₀).
- Stimulus Application:
- Pharmacological: Add Yoda1 (10-30 µM) directly to the dish during imaging.
- Mechanical: Use a blunt glass micropipette to apply localized pressure to a single cell.
- Inhibition Control: Pre-treat a separate cell population with 5 µM GsMTx-4 for 15 min prior to loading and stimulation.
- Data Analysis: Calculate ΔF/F₀ = (F - F₀)/F₀ for each time point. Plot kinetics and quantify peak amplitude and area under the curve.
Protocol: Measuring Piezo1-Mediated Migration in a Stiffness-Tunable 3D Gel
Objective: To evaluate immune cell migration through hydrogels of varying stiffness, mimicking tissue environments.
Materials (Research Reagent Solutions): Table 3: Key Reagents for 3D Migration Assay
| Reagent/Material | Function/Description | Example (Supplier) |
|---|---|---|
| PEG-based Hydrogel Kit | Tunable stiffness 3D matrix. | Cellendes or BioLamina hydrogel kits. |
| Collagen I | Alternative natural polymer matrix. | Corning (354236). |
| Recombinant CCL19 | Chemoattractant for dendritic/T cells. | PeproTech (300-29B). |
| Live-Cell Imaging Chamber | For stable long-term imaging. | Ibidi µ-Slide Chemotaxis. |
| Piezo1 siRNA | For gene knockdown validation. | SMARTpool siRNA (Dharmacon). |
| Anti-Piezo1 Antibody | For validation of knockdown. | Alomone Labs (ACC-043). |
Procedure:
- Gel Preparation: Prepare PEG or collagen I hydrogels with defined stiffness (e.g., 1 kPa [soft, lymphoid] and 20 kPa [stiff, inflamed tissue]) according to manufacturer protocols. Polymerize gels in an Ibidi chamber.
- Cell Embedding: Gently mix activated T cells or dendritic cells with the hydrogel precursor solution prior to polymerization. Seed cells at 1-2 x 10⁵ cells/mL.
- Chemoattractant Gradient: After polymerization, add medium containing 100 ng/mL CCL19 to one reservoir of the chamber to establish a gradient.
- Live-Cell Imaging: Place chamber in an incubator-equipped microscope. Acquire Z-stacks every 5-10 minutes for 6-12 hours.
- Pharmacological/Genetic Modulation: Treat cells with Yoda1 (5 µM) or GsMTx-4 (5 µM) in the gel medium. For knockdown, transfert cells with Piezo1 siRNA 48h prior to embedding.
- Track Analysis: Use tracking software (e.g., Imaris, TrackMate) to calculate migration parameters: speed (µm/min), persistence, and directionality toward the gradient.
Signaling Pathway & Workflow Visualizations
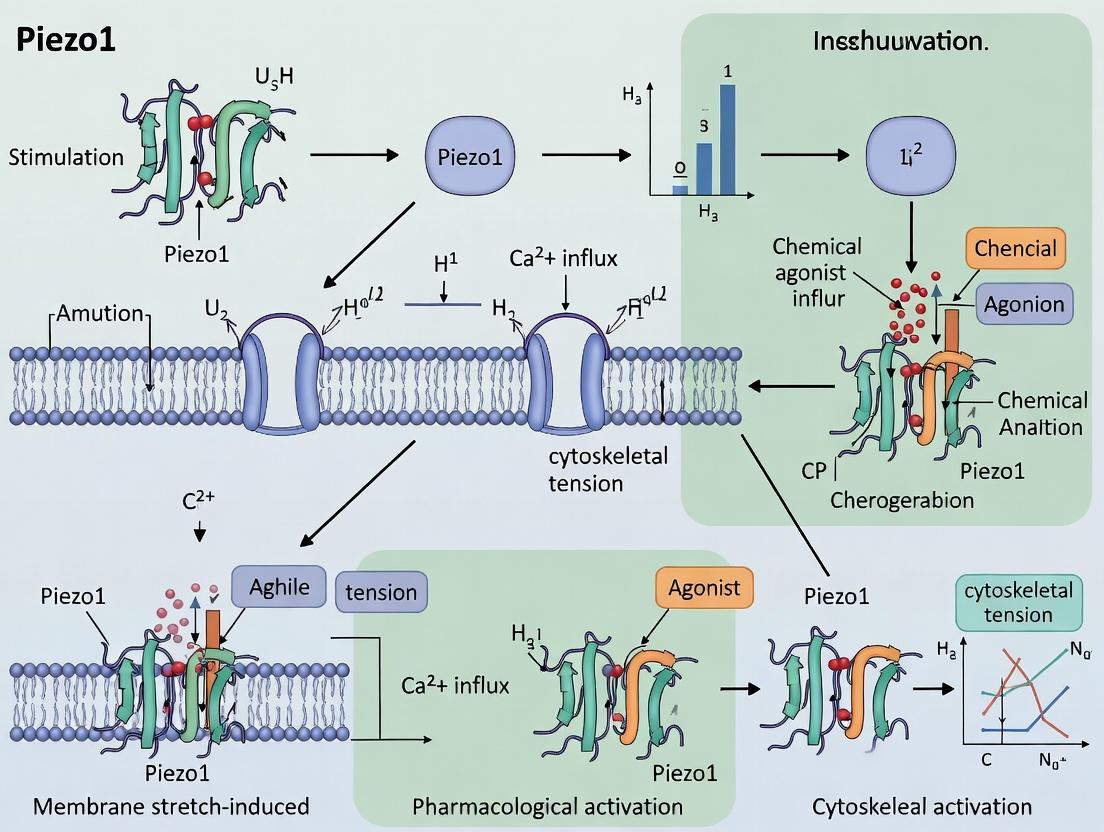
Diagram Title: Piezo1 Mechanotransduction Pathway in Immune Cells
Diagram Title: Experimental Workflow for Piezo1 Immune Function Study
Within the context of a thesis investigating Piezo1 channel activation methods for immune cells research, understanding endogenous physiological triggers is paramount. This Application Note details the primary mechanical stimuli—matrix stiffness and fluid shear stress—that activate the Piezo1 cation channel, a key mechanosensor in immune cell trafficking, differentiation, and function. The protocols and data herein are designed to guide researchers in dissecting these pathways.
Table 1: Quantified Physiological Triggers of Endogenous Piezo1 Activation
| Trigger | Physiological Range | Experimental Model | Key Readout/Effect | Reference (Recent) |
|---|---|---|---|---|
| Substrate Stiffness | 0.5 kPa (bone marrow) to >30 kPa (calcified lesion) | Polyacrylamide hydrogels of tuned stiffness | Macrophage M2 polarization; T cell activation threshold modulation | PMID: 36171345 |
| Fluid Shear Stress (Laminar) | 0.5 - 10 dyne/cm² (lymphatic/venular) | Parallel-plate flow chamber | Endothelial Ca²⁺ influx; Monocyte rolling adhesion inhibition | PMID: 36774518 |
| Membrane Distension (Osmotic) | 10-30% cell area increase | Hypo-osmotic buffer | Rapid Yoda1-independent Ca²⁺ spike in dendritic cells | PMID: 35235789 |
| Cytoskeletal Force | N/A (Actin polymerization-driven) | Latrunculin A inhibition | Impaired Piezo1-mediated Ca²⁺ entry in neutrophils during migration | PMID: 35021083 |
Detailed Experimental Protocols
Protocol 1: Assessing Piezo1-Dependent Immune Cell Responses to Tunable Substrate Stiffness
Application: Studying macrophage polarization or T cell activation in tissue-mimetic mechanical environments.
Materials:
- Primary murine bone marrow-derived macrophages (BMDMs) or human primary T cells.
- Stiffness-tunable polyacrylamide hydrogel kits (e.g., CytoSoft plates or in-house prepared gels).
- Piezo1 agonist (Yoda1, 5-10 µM) and antagonist (GsMTx4, 2-5 µM).
- Fluo-4 AM or Cal-520 AM calcium indicator dye.
- qPCR reagents for polarization markers (Arg1, iNOS for macrophages; IL-2, IFN-γ for T cells).
Method:
- Hydrogel Preparation: Prepare polyacrylamide gels on activated coverslips according to manufacturer protocol. Vary bis-acrylamide crosslinker concentration to achieve soft (0.5-2 kPa), intermediate (8-12 kPa), and stiff (25-30 kPa) substrates. Coat with collagen I or fibronectin.
- Cell Plating: Seed BMDMs or activated T cells onto gels and allow to adhere for 4-6 hours in complete medium.
- Calcium Imaging: Load cells with 2 µM Fluo-4 AM for 30 min at 37°C. Acquire time-lapse images on a confocal microscope. Establish baseline, then add Yoda1 or use a mechanical probe for local stimulation. Include GsMTx4 pre-treatment controls.
- Downstream Analysis: After 24h culture on gels, harvest cells for RNA isolation and qPCR analysis of stiffness-dependent marker genes.
- Validation: Confirm Piezo1-specificity using siRNA knockdown or conditional knockout cells.
Protocol 2: Applying Laminar Shear Stress to Investigate Piezo1 in Immune Cell Adhesion
Application: Modeling lymphocyte or monocyte-endothelial interactions under flow.
Materials:
- Parallel-plate flow chamber system (e.g., Ibidi pump system).
- Human Umbilical Vein Endothelial Cells (HUVECs) or specialized endothelial lines.
- Primary monocytes or lymphocytes.
- Fura-2 AM ratiometric calcium dye.
- Antibodies for immunofluorescence (ICAM-1, VCAM-1).
Method:
- Endothelial Monolayer: Culture HUVECs on a 0.1% gelatin-coated flow chamber slide until confluent. Optionally transduce with Piezo1 siRNA.
- Calcium Dye Loading: Load HUVEC monolayer with 5 µM Fura-2 AM for 45 min at 37°C.
- Shear Stress Application: Mount slide on the flow chamber. Perfuse with pre-warmed, CO₂-equilibrated cell culture medium at a low shear stress (2 dyne/cm²) for 5 min to establish baseline, then increase to physiological shear (10 dyne/cm²). Record real-time ratiometric (340/380 nm) calcium images.
- Adhesion Assay Integration: After applying shear, perfuse fluorescently-labeled monocytes (1x10⁶ cells/mL) over the HUVECs at 1 dyne/cm² for 10 min. Quantify rolling and firmly adherent cells per field.
- Analysis: Correlate endothelial Ca²⁺ flux peaks with subsequent adhesion molecule upregulation and leukocyte adhesion. Use GsMTx4 in the perfusion buffer to inhibit Piezo1.
The Scientist's Toolkit
Table 2: Essential Research Reagent Solutions for Piezo1 Mechanobiology
| Reagent/Material | Function in Piezo1 Research | Example Product/Catalog |
|---|---|---|
| Yoda1 | Small-molecule Piezo1-specific agonist; used as a positive control for activation. | Tocris Bioscience (5586) |
| GsMTx4 | Peptide inhibitor of mechanosensitive ion channels, including Piezo1. | Abcam (ab141871) |
| Tunable Hydrogels | To simulate in vivo tissue stiffness for cell culture. | Advanced BioMatrix (CytoSoft 24-well plates) |
| Parallel-Plate Flow Chamber | To apply precise, laminar fluid shear stress to cell monolayers. | Ibidi (µ-Slide I 0.4 Luer) |
| Genetically-Encoded Ca²⁺ Indicator (GCaMP6) | For long-term, cell-specific calcium imaging in response to mechanical stimuli. | AAV vectors or stable cell lines. |
| Piezo1-siRNA/sgRNA | To knock down or knockout Piezo1 expression for functional validation. | Dharmacon SMARTpool (L-016973-00-0005) |
| Anti-Piezo1 Antibody (Validated) | For immunoblotting, immunofluorescence to localize channel expression. | Proteintech (15939-1-AP) |
Visualizations
Diagram 1: Core Pathways of Physiological Piezo1 Activation in Immune Cells
Diagram 2: Workflow for Shear Stress & Stiffness Activation Experiments
Application Notes
Piezo1, a mechanosensitive ion channel, is a critical regulator of immune cell function in response to physical forces. Its activation by membrane stretch, shear stress, or stiffness modulates Ca²⁺ influx, triggering downstream signaling that influences key immunological processes. This note details its role within a thesis exploring Piezo1 channel activation methods in immune cell research.
1. Migration: Piezo1 senses interstitial pressure and matrix stiffness, guiding immune cell trafficking. In dendritic cells (DCs) and T cells, Piezo1-mediated Ca²⁺ influx activates downstream effectors like calpain, facilitating cytoskeletal rearrangement and integrin activation for chemotaxis.
2. Phagocytosis: In macrophages, Piezo1 activation by the stiffness of a target particle enhances phagocytic efficiency. The Ca²⁺ signal promotes actin polymerization and phagocytic cup formation, crucial for pathogen clearance and apoptotic cell removal.
3. Cytokine Production: Piezo1 activation modulates inflammatory responses. In macrophages, it can promote NLRP3 inflammasome activation and IL-1β secretion under specific mechanical contexts. Conversely, in T cells, it can influence Th1/Th2 cytokine polarization.
4. Differentiation: Piezo1 impacts immune cell fate. In hematopoietic stem cells, shear stress-activated Piezo1 influences lineage commitment. In macrophages, it can modulate M1/M2 polarization in response to matrix mechanics.
Table 1: Key Quantitative Findings on Piezo1 in Immune Cells
| Immune Cell | Process | Key Measurement | Effect of Piezo1 Activation | Reported Change/Value | Reference |
|---|---|---|---|---|---|
| Macrophage | Phagocytosis | Phagocytic Index | Increase on stiff substrate (37 kPa vs. 1 kPa) | ~2.5-fold increase | (Atcha et al., 2021) |
| Dendritic Cell | Migration | Migration Speed | Increase under shear stress (0.5 dyn/cm²) | From ~8 to ~15 µm/min | (Liu et al., 2022) |
| CD4+ T Cell | Cytokine Production | IL-2 Secretion | Reduction with Yoda1 (Piezo1 agonist) | ~40% decrease | (Jairaman et al., 2021) |
| Macrophage | Cytokine Production | IL-1β Release | Increase with Yoda1 + LPS priming | ~3-fold increase | (Solis et al., 2019) |
| Monocyte | Differentiation | M2 Marker (CD206) | Increase on soft matrix (0.5 kPa) | ~4-fold increase vs. rigid | (S. Chakraborty et al., 2023) |
Table 2: Common Piezo1 Modulators in Research
| Reagent | Type | Common Working Concentration | Primary Effect |
|---|---|---|---|
| Yoda1 | Agonist | 1-10 µM | Activates Piezo1 channel |
| GsMTx4 | Inhibitor | 1-5 µM | Mechanically blocks activation |
| Ruthenium Red | Inhibitor | 10-20 µM | Pore blocker |
| Piezo1-siRNA | Genetic Tool | 20-50 nM (transfection) | Knocks down Piezo1 expression |
| Dooku1 | Antagonist | 5-20 µM | Inhibits Yoda1-induced activation |
Experimental Protocols
Protocol 1: Assessing Macrophage Phagocytosis on Tunable Stiffness Hydrogels
Objective: To quantify the effect of substrate stiffness/Piezo1 activation on macrophage phagocytic capacity. Materials: RAW 264.7 or BMDMs, polyacrylamide hydrogels (1-50 kPa), Yoda1/GsMTx4, pHrodo Red E. coli Bioparticles, fluorescence microscope. Procedure:
- Hydrogel Preparation: Prepare polyacrylamide gels of defined stiffness (e.g., 1, 10, 37 kPa) coated with fibronectin.
- Cell Seeding & Treatment: Seed macrophages (50,000 cells/well) on gels. Pre-treat with 5 µM Yoda1, 2 µM GsMTx4, or vehicle for 30 min.
- Phagocytosis Assay: Add pHrodo Red E. coli bioparticles (10 µg/mL). pHrodo fluoresces brightly only in phagolysosomes.
- Imaging & Quantification: After 90 min, fix cells and image. Calculate phagocytic index = (total fluorescence intensity / number of cells).
- Analysis: Compare indices across stiffness conditions and drug treatments.
Protocol 2: Measuring T Cell Migration in a Microfluidic Shear Flow System
Objective: To evaluate Piezo1-mediated chemotaxis under physiological shear stress. Materials: Primary human CD4+ T cells, µ-Slide I Luer microfluidic chamber, syringe pump, CCL19 chemokine, Yoda1, time-lapse microscope. Procedure:
- Cell Preparation: Isolate CD4+ T cells and pre-treat with 10 µM Yoda1 or DMSO for 20 min.
- Channel Setup: Load CCL19 (100 ng/mL) in the reservoir channel. Fill main channel with cell suspension (1x10⁶ cells/mL).
- Shear Application: Use syringe pump to apply laminar shear stress (0.5 dyn/cm²).
- Image Acquisition: Capture time-lapse images every 30 sec for 30 min at 37°C.
- Tracking Analysis: Use manual tracking or software (e.g., ImageJ Manual Tracker) to calculate migration speed and directionality.
Protocol 3: Cytokine Profiling in Piezo1-modulated Macrophages
Objective: To analyze Piezo1's role in LPS-induced cytokine secretion. Materials: BMDMs, LPS, Yoda1, GsMTx4, ELISA kits for IL-1β, TNF-α, IL-6, cell culture supernatant collection tubes. Procedure:
- Cell Stimulation: Seed BMDMs. Pre-treat with 5 µM Yoda1 and/or 2 µM GsMTx4 for 30 min.
- LPS Priming: Stimulate cells with 100 ng/mL LPS for 4 hours.
- Supernatant Collection: Centrifuge culture media at 300 x g for 5 min. Collect supernatant and store at -80°C.
- ELISA: Perform standard sandwich ELISA for target cytokines according to manufacturer protocol.
- Data Normalization: Normalize cytokine concentration to total cellular protein or cell count.
Protocol 4: Flow Cytometric Analysis of Monocyte-to-Macrophage Differentiation
Objective: To assess the impact of Piezo1 on matrix stiffness-dependent macrophage polarization. Materials: THP-1 monocytes or primary monocytes, collagen-coated polyacrylamide gels (0.5 kPa & 50 kPa), PMA, Yoda1, antibodies for CD11b, CD86, CD206. Procedure:
- Differentiation on Gels: Seed THP-1 cells on soft (0.5 kPa) and stiff (50 kPa) gels. Differentiate with 100 nM PMA for 48 hours ± 10 µM Yoda1.
- Harvesting: Carefully lift cells using gentle cell scraping in PBS+EDTA.
- Staining: Stain cells with anti-CD11b (pan-macrophage), anti-CD86 (M1), and anti-CD206 (M2) for 30 min on ice.
- Flow Cytometry: Analyze on a flow cytometer. Gate on CD11b+ cells and calculate MFI ratios for CD86 and CD206.
The Scientist's Toolkit: Research Reagent Solutions
Table 3: Essential Materials for Piezo1-Immune Research
| Item | Function/Application | Example Vendor/Cat. No. |
|---|---|---|
| Yoda1 | Small molecule Piezo1 agonist; induces calcium influx for activation studies. | Tocris, 5586 |
| GsMTx4 | Peptide inhibitor of mechanosensitive ion channels; selective for Piezo1 blocking. | Abcam, ab141871 |
| Piezo1 siRNA | For targeted knockdown of PIEZO1 gene to confirm channel-specific effects. | Santa Cruz Biotechnology, sc-156168 |
| Piezo1 Antibody | For Western blot, immunofluorescence to detect protein expression/localization. | Proteintech, 15939-1-AP |
| Tunable Hydrogel Kits | Polyacrylamide or PEG-based kits to create substrates of defined stiffness. | Cell Guidance Systems, PAA-1K or Advanced BioMatrix, 5040-1 |
| Intracellular Ca²⁺ Indicators | Dyes (e.g., Fluo-4 AM) to measure Piezo1-mediated calcium flux in real-time. | Thermo Fisher, F14201 |
| pHrodo Bioparticles | Phagocytosis probes; fluorescence increases with acidification in phagosomes. | Thermo Fisher, P35361 |
| Microfluidic Chambers | Devices (e.g., µ-Slide) to apply precise shear stress for migration studies. | ibidi, 80176 |
Diagrams
Diagram Title: Piezo1 Mechanotransduction Signaling to Immune Functions
Diagram Title: Phagocytosis Assay on Stiffness Hydrogels Workflow
Diagram Title: Microfluidic T Cell Migration Assay Setup
Application Notes
Piezo1, a mechanosensitive cation channel, is now recognized as a critical molecular link between physical forces and biological signaling in immune cells and the tumor microenvironment. Dysfunctional Piezo1 activity is implicated in pathological immune responses and cancer progression. These application notes synthesize current research and provide practical methodologies for investigating Piezo1 in these contexts, framed within a thesis on Piezo1 channel activation methods in immune cell research.
Key Pathophysiological Links
- Autoimmunity & Chronic Inflammation: Loss-of-function Piezo1 mutations or inhibition in macrophages and dendritic cells impair phagocytosis and efferocytosis, leading to unresolved inflammation and autoantigen presentation. In T cells, altered Piezo1 signaling affects activation and differentiation, contributing to diseases like rheumatoid arthritis and lupus.
- Cancer Immunosuppression: In the solid tumor microenvironment, elevated extracellular matrix stiffness activates Piezo1 in tumor-associated macrophages (TAMs), promoting an immunosuppressive M2 phenotype. Piezo1 activation in regulatory T cells (Tregs) enhances their suppressive function, facilitating immune evasion.
- Cancer Cell Intrusion: In carcinoma cells, Piezo1 activation by mechanical cues promotes invasion, metastasis, and resistance to apoptosis. It also regulates cell division and organelle function, contributing to tumorigenesis.
Table 1: Quantitative Associations Between Piezo1 Dysfunction and Disease Phenotypes
| Disease/Condition | Cell Type | Piezo1 Dysfunction | Key Measurable Outcome | Representative Change (vs. Control) | Citation (Type) |
|---|---|---|---|---|---|
| Rheumatoid Arthritis | Synovial Macrophages | Reduced Activity | Phagocytosis Capacity | ↓ ~40-60% | Solis et al., 2019 |
| Breast Cancer (TNBC) | Carcinoma Cells | Gain-of-Function (Activation by Stiffness) | Invasion through Matrigel | ↑ 3.5-fold | Wei et al., 2022 |
| Colorectal Cancer | Tumor-Associated Macrophages (TAMs) | Increased Activity | Expression of M2 marker ARG1 | ↑ 2.8-fold | Li et al., 2023 |
| Experimental Autoimmune Encephalomyelitis (EAE) | Dendritic Cells | Conditional Knockout | Antigen-Specific T cell Proliferation | ↓ ~70% | Jairaman et al., 2021 |
| Lung Metastasis | Breast Cancer Cells | Pharmacological Inhibition | Number of Metastatic Nodules | ↓ ~65-80% | Yang et al., 2023 |
Protocols
Protocol 1: Assessing Piezo1-Dependent Macrophage PhagocytosisIn Vitro
Objective: To quantify the effect of Piezo1 modulation on the phagocytic activity of primary macrophages.
Research Reagent Solutions:
| Item | Function/Specification |
|---|---|
| Primary Bone Marrow-Derived Macrophages (BMDMs) | Differentiated from C57BL/6 or Piezo1-floxed mouse bone marrow. |
| Yoda1 | Piezo1-specific agonist (Tocris, #5586), used at 5-10 µM. |
| GsMTx4 | Piezo1 inhibitor (peptide toxin), used at 2-5 µM. |
| pHrodo Red Bioparticles | E. coli or S. aureus particles that fluoresce upon phagolysosomal acidification (Invitrogen). |
| Live-Cell Imaging System | Equipped with environmental control (37°C, 5% CO₂) and time-lapse capability. |
| Flow Cytometer | For end-point quantification of particle uptake. |
Methodology:
- Macrophage Preparation: Differentiate BMDMs in complete RPMI with M-CSF (20 ng/mL) for 7 days. Seed cells in imaging-compatible plates 24h prior to assay.
- Pre-treatment: Treat cells with vehicle (DMSO), Yoda1 (5 µM), or GsMTx4 (4 µM) for 30 minutes.
- Phagocytosis Assay: Add pHrodo Red Bioparticles (10 µg/mL) directly to the medium. Immediately begin time-lapse imaging (acquire red fluorescence channel every 5 minutes for 90-120 minutes).
- Quantification (Image Analysis): Using Fiji/ImageJ, threshold images and measure the integrated fluorescence density per cell over time. Alternatively, for flow cytometry, stop reaction at 60 min by washing with cold PBS+EDTA, detach cells, and analyze median fluorescence intensity (MFI) of the pHrodo Red signal.
Protocol 2: Evaluating Piezo1-Mediated Treg Suppression in a Co-Culture System
Objective: To measure the effect of matrix stiffness/Piezo1 activation on regulatory T cell (Treg) suppressive function.
Research Reagent Solutions:
| Item | Function/Specification |
|---|---|
| Polyacrylamide Hydrogels | Tunable stiffness substrates (e.g., 1 kPa vs. 50 kPa) (Softwell kits or in-house fabrication). |
| CD4+ CD25+ Treg Isolation Kit | For magnetic or FACS-based isolation from mouse spleen/human PBMCs. |
| Carboxyfluorescein succinimidyl ester (CFSE) | Cell proliferation dye for labeling responder T cells. |
| Anti-CD3/CD28 Dynabeads | For T cell stimulation. |
| Mouse IL-2 | Cytokine for Treg culture, used at 100 U/mL. |
Methodology:
- Treg Pre-conditioning: Isolate naive Tregs. Seed onto soft (1 kPa) or stiff (50 kPa) collagen-coated polyacrylamide gels in Treg media (complete RPMI + IL-2). Culture for 48h.
- Responder T Cell Preparation: Isolate CD4+CD25- conventional T cells (Tconvs) from a compatible donor. Label with CFSE (2.5 µM) for 10 min at 37°C.
- Suppression Co-culture: Harvest pre-conditioned Tregs. Set up co-cultures in round-bottom 96-well plates: mix CFSE-labeled Tconvs (5x10⁴ cells/well) with irradiated antigen-presenting cells and anti-CD3/CD28 beads. Add pre-conditioned Tregs at varying ratios (e.g., 1:1, 1:2 Treg:Tconv). Include Tconv-only wells as proliferation controls.
- Analysis: After 72-96h, analyze cells by flow cytometry. Gate on CFSE+ Tconvs and assess proliferation via CFSE dilution. Calculate % suppression = (1 - (% divided Tconvs with Tregs / % divided Tconvs without Tregs)) * 100.
Protocol 3: Measuring Piezo1-Dependent Cancer Cell Invasion in a 3D Matrix
Objective: To test the role of Piezo1 in mediating stiffness-induced cancer cell invasion.
Research Reagent Solutions:
| Item | Function/Specification |
|---|---|
| Transwell Inserts | 8.0 µm pore size, for 24-well plates. |
| Growth Factor-Reduced Matrigel | Basement membrane matrix, kept on ice. |
| Type I Collagen (High Concentration) | For preparing stiff (e.g., 5 mg/mL) 3D matrices. |
| Calcein-AM | Live-cell fluorescent stain (2 µM) for visualizing/quantifying invaded cells. |
Methodology:
- Matrix Coating: On ice, mix Matrigel with neutralized Type I Collagen to desired final concentration/stiffness. Add 100 µL to the top chamber of each Transwell insert. Polymerize at 37°C for 1h.
- Cell Preparation: Serum-starve cancer cells (e.g., MDA-MB-231) for 4h. Pretreat with DMSO, Yoda1 (10 µM), or GsMTx4 (5 µM) for 30 min. Harvest and resuspend in serum-free medium.
- Invasion Assay: Add 500 µL of complete medium (chemoattractant) to the lower chamber. Seed 2.5x10⁴ pretreated cells in 200 µL serum-free medium into the top chamber. Incubate for 18-24h at 37°C.
- Quantification: Remove non-invaded cells from the top chamber with a cotton swab. Immerse insert in PBS containing Calcein-AM for 30 min at 37°C. Image bottom of insert using a fluorescence microscope. Count cells in 4-5 random fields per insert. Express data as "Invaded Cells per Field" or fold-change relative to control.
Visualizations
Diagram 1: Piezo1 Dysfunction in Disease Pathogenesis
Diagram 2: Piezo1 Macrophage Phagocytosis Assay Workflow
Activating Piezo1: Experimental Methods and Techniques for Immune Cell Research
Within the broader thesis on Piezo1 channel activation methods in immune cells research, small-molecule agonists like Yoda1 and Jedi1/2 represent critical tools for probing channel function. Piezo1 is a mechanosensitive cation channel implicated in immune cell maturation, migration, and inflammatory responses. Pharmacological activation provides a controlled alternative to mechanical stimulation, allowing for precise dissection of Piezo1's role in immunological processes. This document outlines the mechanisms, specificity, and practical application of these agonists.
Mechanisms and Specificity of Piezo1 Agonists
Mechanism of Action
Yoda1 and Jedi compounds are allosteric modulators that lower the mechanical activation threshold of Piezo1. They are proposed to bind to a site within the Piezo1 trimer, stabilizing an open conformation. This action allows channel opening under physiological membrane tension levels that would otherwise be insufficient.
Table 1: Properties of Piezo1 Chemical Agonists
| Property | Yoda1 | Jedi1 | Jedi2 |
|---|---|---|---|
| Chemical Name | (4-((2,5-Dimethylphenoxy)methyl)-2-(trifluoromethyl)pyridine) | (Ethyl 2-(5-(((2,4-Dimethylbenzyl)oxy)methyl)-3-(trifluoromethyl)-1H-pyrazol-1-yl)acetate) | (Ethyl 2-(5-(((2,4-dimethylbenzyl)oxy)methyl)-3-(trifluoromethyl)-1H-pyrazol-1-yl)thio)acetate) |
| Primary Target | Piezo1 | Piezo1 | Piezo1 |
| Reported EC₅₀ | ~10-30 µM (cell-based assays) | ~0.5-2 µM (reported as more potent than Yoda1) | ~0.2-1 µM (reported as most potent in series) |
| Specificity | Selective for Piezo1 over Piezo2; minimal activity on unrelated ion channels at working concentrations. | Higher selectivity window for Piezo1 vs. Piezo2 compared to Yoda1. | Similar or improved selectivity profile relative to Jedi1. |
| Key Advantage | Well-characterized, widely used benchmark compound. | Increased potency. "Jedi" name denotes improved properties. | Increased potency and potentially improved pharmacological properties. |
| Key Limitation | Moderate potency, potential light sensitivity, limited aqueous solubility. | Less extensively validated in biological systems than Yoda1. | Less extensively validated in biological systems than Yoda1. |
Signaling Pathways in Immune Cells
Activation of Piezo1 by these agonists in immune cells triggers Ca²⁺ influx, leading to downstream signaling cascades.
Diagram Title: Piezo1 Agonist Signaling in Immune Cells
The Scientist's Toolkit: Research Reagent Solutions
Table 2: Essential Reagents for Piezo1 Agonist Studies
| Reagent/Material | Function/Description | Example Supplier/Cat. No. |
|---|---|---|
| Yoda1 | Benchmark Piezo1 agonist. Reconstitute in DMSO for stock solutions. | Tocris, 5586 |
| Jedi1/2 | Potent, next-generation Piezo1 agonists. Handle similarly to Yoda1. | Custom synthesis (literature) |
| GSMTx4 | Peptide inhibitor of mechanosensitive channels, including Piezo1. Useful as a negative control. | Tocris, 4912 |
| Dantrolene | RyR inhibitor; used to block ER Ca²⁺ release, helping isolate Piezo1-mediated Ca²⁺ influx. | Sigma-Aldrich, D9175 |
| Fluo-4 AM or Fura-2 AM | Cell-permeable, ratiometric Ca²⁺ indicators for measuring agonist-induced influx. | Thermo Fisher, F14201 / F1221 |
| Piezo1 siRNA/shRNA | For genetic knockdown to confirm agonist specificity in phenotypic assays. | Santa Cruz Biotechnology, sc-... |
| Piezo1-Overexpressing Cell Line | Engineered cell line (e.g., HEK293T) for validating agonist activity and conducting patch-clamp studies. | Available from academic labs. |
| Vehicle-Grade DMSO | High-purity solvent for preparing agonist stock solutions. Keep anhydrous. | Sigma-Aldrich, D2650 |
Detailed Application Notes and Protocols
Protocol: Agonist Stock Preparation and Storage
Objective: To prepare stable, concentrated stock solutions of Yoda1/Jedi compounds. Materials: Yoda1 (Tocris 5586) powder, anhydrous DMSO, sterile microcentrifuge tubes, balance, biosafety cabinet. Procedure:
- Warm Yoda1 vial to room temperature before opening to prevent condensation.
- In a biosafety cabinet, add calculated volume of anhydrous DMSO to achieve a 10 mM stock concentration (e.g., add 1.236 mL DMSO to 5 mg of Yoda1 [MW: 403.4]).
- Vortex vigorously for 1-2 minutes until fully dissolved.
- Aliquot stock solution into small, single-use volumes (e.g., 10-20 µL) in sterile microcentrifuge tubes.
- Store aliquots at -80°C, protected from light. Avoid repeated freeze-thaw cycles (max 2-3 cycles). Note: Jedi1/2 stocks are prepared similarly, adjusting for molecular weight. Confirm solubility in 100% DMSO.
Protocol: Measuring Calcium Influx in Immune Cells (Macrophages/T Cells)
Objective: To quantify Piezo1-mediated Ca²⁺ signaling using a fluorometric plate reader. Materials: Primary immune cells or cell line, Fluo-4 AM dye, HBSS buffer with Ca²⁺, poly-L-lysine coated 96-well plate, plate reader with kinetic capability, Yoda1/Jedi stocks. Procedure:
- Cell Plating: Seed cells in a poly-L-lysine coated black-walled, clear-bottom 96-well plate at ~50,000 cells/well. Culture overnight.
- Dye Loading: Replace medium with 100 µL of HBSS + 2-5 µM Fluo-4 AM. Incubate for 45-60 min at 37°C, 5% CO₂.
- Dye Removal: Wash cells 2x with warm HBSS (+Ca²⁺). Add 100 µL fresh HBSS per well.
- Plate Reader Setup: Pre-warm plate reader to 37°C. Set excitation/emission to ~494/516 nm. Read fluorescence every 1-2 seconds.
- Agonist Addition:
- Establish a baseline for 30-60 seconds.
- Pause reading, inject 11.1 µL of 10x agonist (or vehicle control) into each well to achieve final desired concentration (e.g., 10 µL into 100 µL for 1:10 dilution). Use instrument injectors if available.
- Immediately resume reading for 3-5 minutes.
- Data Analysis: Calculate ΔF/F₀, where F₀ is the average baseline fluorescence. Graph kinetics and compare peak response.
Diagram Title: Calcium Flux Assay Workflow
Protocol: Validating Specificity in Functional Assays (e.g., Cell Migration)
Objective: To confirm that agonist-induced phenotypic changes are Piezo1-dependent. Materials: Transwell migration chambers, siRNA against Piezo1, negative control siRNA, cell culture media, chemoattractant (e.g., CCL19), Matrigel (for invasion assays). Procedure:
- Knockdown: Transfect cells with Piezo1-specific or control siRNA 48-72 hours prior to assay.
- Assay Setup:
- For a Transwell migration assay, add chemoattractant to the lower chamber.
- Resuspend agonist-treated (e.g., 10 µM Yoda1, 30 min pre-treatment) or vehicle-treated cells in serum-free medium and seed into the upper chamber.
- Incubate for 4-24 hours at 37°C to allow migration.
- Analysis: Remove non-migrated cells from the upper chamber. Fix and stain migrated cells on the lower membrane. Count cells in 5 random fields per well.
- Interpretation: A significant reduction in Yoda1-enhanced migration specifically in Piezo1-knockdown cells, but not in control siRNA cells, confirms on-target activity.
Table 3: Summary of Key Experimental Parameters from Literature
| Experiment Type | Recommended Agonist Conc. | Pre-Treatment Time | Key Assay Readout | Control Experiments Required |
|---|---|---|---|---|
| Ca²⁺ Imaging | Yoda1: 10-30 µM; Jedi1/2: 0.5-2 µM | Acute addition (kinetic) | Peak ΔF/F₀ or area under the curve (AUC) of Ca²⁺ trace | Vehicle (DMSO), GsMTx4 pre-treatment, Ca²⁺-free medium. |
| Patch-Clamp Electrophysiology | 5-20 µM (Yoda1) | Perfused during recording | Increase in mechanically evoked current, baseline current shift. | Vehicle perfusion. Use Piezo1-knockout/knockdown cells. |
| Cell Migration (Immune) | 5-20 µM (Yoda1) | 30 min - 2 hours pre-treatment | Number of migrated/invaded cells. | Vehicle, GsMTx4, siRNA-mediated Piezo1 knockdown. |
| Gene Expression (qPCR) | 10-30 µM (Yoda1) | 4-6 hours | Fold-change in Piezo1-regulated genes (e.g., inflammatory cytokines). | Vehicle control, actinomycin D to block transcription. |
Within the broader thesis exploring Piezo1 channel activation methods in immune cells, direct mechanical stimulation assays are foundational. Piezo1, a mechanically-activated cation channel, is a primary mechanosensor in macrophages, T cells, and dendritic cells. Understanding its role in immune responses requires precise methodologies to apply defined mechanical cues—substrate stretching (uniaxial/biaxial strain), pressure (osmotic/hydrostatic), and shear flow (laminar fluid stress). These assays probe how mechanical forces translate into biochemical signals via Piezo1, influencing immune cell maturation, migration, and effector functions. This document provides detailed application notes and protocols for these critical techniques.
Substrate Stretching Assays
Application Note: Used to simulate tissue distension or extracellular matrix (ECM) deformation. Cyclic or static stretching of compliant membranes activates Piezo1, leading to calcium influx and downstream signaling affecting NF-κB and YAP/TAZ nuclear translocation in macrophages.
Protocol: Uniaxial Cyclic Stretch of Adherent Macrophages
- Cell Seeding: Seed differentiated primary human or murine macrophages (e.g., THP-1 derived) onto silicone-based elastic membranes (e.g., Flexcell plates) coated with fibronectin (10 µg/mL).
- Stimulation: Place membrane in stretch system (e.g., FX-6000T Flexcell). Program parameters: 10% elongation, 0.5 Hz frequency (cyclic), 30 min duration. Include static (0%) and unstretched controls.
- Live-Cell Imaging: Load cells with Fura-2AM (5 µM) calcium dye 30 min prior. Image using ratiometric (340/380 nm excitation) fluorescence microscopy before, during, and after stretch.
- Analysis: Quantify peak ΔF/F0 calcium response. Fix cells post-stretch for immunostaining (e.g., YAP cellular localization).
Key Quantitative Data: Substrate Stretching
| Cell Type | Strain Type | Amplitude | Frequency | Piezo1-Dependent Ca²⁺ Peak (ΔR/R₀) | Key Downstream Effect |
|---|---|---|---|---|---|
| Primary Mouse Macrophages | Uniaxial Cyclic | 10% | 0.5 Hz | 1.8 ± 0.3* | NF-κB p65 Nuclear Translocation |
| Human THP-1 Macrophages | Biaxial Static | 15% | N/A | 1.2 ± 0.2* | Increased IL-1β Secretion |
| Mouse Dendritic Cells | Uniaxial Cyclic | 8% | 1.0 Hz | 0.9 ± 0.15* | Enhanced CCR7 Expression |
*Response abolished by Piezo1 inhibitor GsMTx4 (5 µM).
Pressure Stimulation Assays
Application Note: Hydrostatic or osmotic pressure systems model conditions like interstitial pressure or cellular swelling. Piezo1 acts as a baroreceptor, with pressure-triggered currents modulating inflammasome activation in monocytes.
Protocol: Hydrostatic Pressure Application to Myeloid Cells
- Setup: Use a pressurized incubation chamber (e.g., Stage Top Incubator with pressure regulator). Calibrate system for rapid pressure application (<1 sec).
- Cell Preparation: Plate U937 monocytes or BMDMs on glass-bottom dishes. Transfect with Piezo1-GFP if needed.
- Stimulation & Electrophysiology: Apply square-wave pressure steps (e.g., -20 to +40 mmHg) via a pressure clamp apparatus while performing whole-cell patch clamp recording. Hold potential at -60 mV.
- Pharmacology: Perfuse with Piezo1 agonist Yoda1 (10 µM) or antagonist GsMTx4 (5 µM) to validate currents.
Key Quantitative Data: Pressure Stimulation
| Stimulus Type | Pressure Magnitude | Cell Model | Piezo1 Current Density (pA/pF) | Activation Time Constant (τ, ms) | Associated Outcome |
|---|---|---|---|---|---|
| Hydrostatic Pressure | +30 mmHg | HEK293-Piezo1 | 25.4 ± 3.1 | 5.8 ± 0.7 | Reference Control |
| Osmotic Shock (Hypotonic) | -50 mOsm | RAW 264.7 Macrophages | 12.7 ± 2.4 | 12.3 ± 1.5 | NLRP3 Inflammasome Priming |
| Hydrostatic Pressure | +20 mmHg | Human Monocytes | 8.9 ± 1.8 | 15.2 ± 2.1 | Increased TNF-α mRNA |
Shear Flow Assays
Application Note: Laminar shear stress mimics blood flow or lymphatic vessel environments. Shear stress activates Piezo1 on lymphocytes and dendritic cells, regulating integrin activation and transmigration.
Protocol: Laminar Shear Stress on T Cells in Flow Chamber
- Coating: Coat µ-Slide I 0.4 Luer (ibidi) with ICAM-1 (5 µg/mL) and/or VCAM-1 (2 µg/mL) overnight at 4°C.
- Cell Loading: Resuspend Jurkat T cells or primary CD4+ T cells in flow buffer (HBSS + 2% FBS) at 1x10⁶ cells/mL. Inject into slide.
- Shear Application: Connect slide to a programmable syringe pump or perfusion system. Apply defined laminar shear stress (e.g., 0.5 - 2.0 dyn/cm²) for 10 min. Calculate flow rate using: Q = (τ * w * h²) / (6η), where τ=shear, w=width, h=height, η=viscosity.
- Real-Time Imaging: Record cell morphology and calcium (using Fluo-4 AM) via time-lapse microscopy. Analyze adhesion and spreading dynamics.
Key Quantitative Data: Shear Flow Assays
| Immune Cell Type | Shear Stress (dyn/cm²) | Substrate | % Cells with Ca²⁺ Flux | Avg. Arrest Time (sec) | Piezo1-Dependent Effect |
|---|---|---|---|---|---|
| Mouse Naive CD4+ T Cell | 1.0 | ICAM-1 | 68% ± 8% | 25 ± 4 | Yes (GsMTx4 sensitive) |
| Human Dendritic Cell | 0.5 | Fibronectin | 45% ± 7% | N/A | Increased Podosome Formation |
| Jurkat T Cell (Piezo1 KO) | 2.0 | ICAM-1 | <10%* | <5* | Loss of Shear Sensing |
*Compared to >60% in WT.
The Scientist's Toolkit: Key Research Reagent Solutions
| Item | Function/Application | Example Product/Catalog # |
|---|---|---|
| Flexcell FX-6000T System | Computerized system for applying precise cyclic or static stretch to cells on elastic membranes. | Flexcell International |
| ibidi µ-Slide I 0.4 Luer | Microfluidic slide for applying laminar shear flow with live-cell imaging compatibility. | ibidi, 80176 |
| GsMTx4 Peptide | Selective inhibitor of mechanosensitive ion channels, including Piezo1. Used at 1-5 µM. | Tocris, 4912 |
| Yoda1 | Small molecule Piezo1 channel agonist. Used to potentiate mechanically-induced responses (5-20 µM). | Sigma-Aldrich, SML1558 |
| Fura-2 AM, cell permeant | Ratiometric fluorescent calcium indicator for quantifying intracellular Ca²⁺ dynamics. | Thermo Fisher, F1221 |
| Anti-Piezo1 Antibody | For validation of Piezo1 expression via Western blot or immunofluorescence. | Alomone Labs, APC-087 |
| Silicone Stretch Membranes | Bioflex culture plates with elastic, protein-coatable bottoms for stretch experiments. | Flexcell, BF-3001U |
| Pressurized Incubation Chamber | Stage-top chamber for applying controlled hydrostatic pressure during microscopy. | Live Cell Instrument |
| CellRaft Array for Mechanobiology | Microwell array for isolating and tracking single cells under mechanical stimulation. | CellMicrosystems |
Detailed Signaling Pathway & Experimental Workflows
Title: Piezo1 Signaling Pathways Under Mechanical Force
Title: Mechanostimulation Assay Workflow
Application Notes
Within the broader thesis investigating Piezo1 channel activation methods in immune cells, these genetic and molecular tools are indispensable for dissecting specific functions. Overexpression drives high levels of channel activity to probe maximal mechanosensitive signaling consequences. Precise Knock-in strategies enable endogenous tagging or gain/loss-of-function mutations to study physiological regulation. Optogenetic control, via engineered light-sensitive channels, allows for millisecond-precise, spatially defined Piezo1 activation without mechanical stimuli, isolating downstream signaling kinetics. Combined, these approaches enable causal interrogation of Piezo1’s role in processes like macrophage phagocytosis, T cell migration, and dendritic cell maturation.
Table 1: Comparison of Piezo1 Genetic Manipulation Tools
| Tool | Typical Efficiency (Mammalian Immune Cells) | Key Advantage | Primary Use in Immune Cell Research | Temporal Control |
|---|---|---|---|---|
| Viral Overexpression | 70-90% (transduction) | High expression level; Broad cell type applicability | Screening phenotypic outcomes of hyperactivation (e.g., cytokine release) | Poor (chronic) |
| CRISPR/Cas9 Knock-in | 10-40% (HDR-dependent) | Endogenous, physiological expression; Tagging for imaging | Studying native localization & regulation; Functional SNP modeling | None (stable) |
| Optogenetic Control (LOV/Channelrhodopsin) | 60-80% (transduction) | Millisecond precision; No mechanical confound | Mapping rapid Ca2+ signaling to downstream phosphorylation/transcription | Excellent (acute) |
Table 2: Functional Readouts from Piezo1 Manipulation in Immune Cells
| Experimental Manipulation | Immune Cell Type | Key Measured Outcome (Quantitative Change) | Assay Method |
|---|---|---|---|
| Piezo1 Overexpression | Macrophage (RAW 264.7) | ↑ Ca2+ influx (ΔF/F0: ~200% vs. 80% in control) | Live-cell Fura-2AM imaging |
| Piezo1 Knock-in (GFP tag) | Primary Dendritic Cells | Endogenous Piezo1 motility (Mean Diffusion Coeff: 0.12 µm²/s) | FRAP (Fluorescence Recovery After Photobleaching) |
| Opto-Piezo1 Activation | Jurkat T Cells | ↑ NFAT nuclear translocation (t1/2: ~8 min post-light) | Confocal microscopy, NFAT-GFP reporter |
Experimental Protocols
Protocol 1: Lentiviral Overexpression of Piezo1 in Primary Murine Macrophages
Objective: Achieve sustained high-level expression of mouse Piezo1 for chronic activation studies. Materials: pLVX-Piezo1-IRES-mCherry plasmid, Lenti-X 293T cells, Lipofectamine 3000, psPAX2, pMD2.G, Polybrene (8 µg/mL), BMDM differentiation media (M-CSF). Procedure:
- Virus Production: Co-transfect Lenti-X 293T cells with pLVX-Piezo1, psPAX2, and pMD2.G using Lipofectamine 3000. Harvest supernatant at 48h and 72h post-transfection. Concentrate using PEG-it virus precipitation solution.
- Target Cell Preparation: Differentiate bone marrow progenitors in M-CSF (20 ng/mL) for 7 days to obtain bone marrow-derived macrophages (BMDMs).
- Transduction: On day 6, seed BMDMs at 2x10^5 cells/well in a 24-well plate. Add concentrated viral supernatant supplemented with Polybrene. Centrifuge at 800 x g for 30 min at 32°C (spinoculation).
- Selection & Validation: 48h post-transduction, assay mCherry fluorescence by flow cytometry. Validate overexpression by qPCR (relative to control, >20-fold increase expected) and functional Yoda1 response via calcium imaging.
Protocol 2: CRISPR/Cas9-Mediated Knock-in of an HA-Tag at the Piezo1 Locus in a Monocyte Cell Line
Objective: Endogenously tag Piezo1 for immunoprecipitation and localization studies. Materials: THP-1 cells, ssODN donor template (with HA tag and homology arms), Cas9 nuclease, synthetic gRNA (targeting C-terminus before STOP codon), Neon Transfection System, Puromycin selection. Procedure:
- Design: Design gRNA targeting genomic region just 5' of the Piezo1 STOP codon. Design a 200bp ssODN donor containing the HA tag sequence (TACCCATACGATGTTCCAGATTACGCT) flanked by 80bp homology arms.
- Electroporation: Co-deliver 20 µg Cas9 protein, 200 pmol gRNA, and 200 pmol ssODN donor into 2x10^6 THP-1 cells using the Neon System (1400V, 20ms, 2 pulses).
- Clonal Selection: Allow recovery for 48h, then dilute and plate in 96-well plates for single-cell clonal expansion. Screen clones by genomic PCR of the targeted locus.
- Validation: Confirm HA tag insertion by sequencing. Validate protein expression via Western blot (anti-HA antibody) and immunofluorescence under basal and stimulatory conditions.
Protocol 3: Acute Optogenetic Activation of Engineered Piezo1 in T Cells
Objective: Use light to trigger Piezo1-dependent Ca2+ signaling with high temporal precision. Materials: Jurkat T cells stably expressing "Opto-Piezo1" (Piezo1 fused to a light-oxygen-voltage (LOV) domain), 470nm blue LED light array, Fluo-4 AM dye (5 µM), HBSS imaging buffer. Procedure:
- Cell Loading: Harvest Opto-Piezo1 Jurkat cells, wash, and incubate with Fluo-4 AM in serum-free RPMI for 30 min at 37°C. Wash and resuspend in HBSS.
- Calcium Imaging Setup: Plate cells in a glass-bottom dish. Mount on a confocal microscope or a system with integrated LED array. Set imaging to acquire at 2 frames/second.
- Light Stimulation: After 30s of baseline acquisition, deliver a 1-second pulse of 470nm blue light (5 mW/mm² intensity) via the LED array. Continue imaging for 5+ minutes.
- Analysis: Calculate ΔF/F0 for individual cells. Compare kinetics (time-to-peak, decay tau) between stimulated and non-stimulated (no light) control cells.
Diagrams
Title: Lentiviral Overexpression Workflow for Piezo1
Title: Core Piezo1-Ca2+-NFAT Signaling Pathway in Immune Cells
Title: Optogenetic Control Mechanism of Engineered Piezo1
The Scientist's Toolkit: Essential Research Reagents & Materials
| Reagent/Material | Function/Application | Example Product/Catalog |
|---|---|---|
| pLVX-Piezo1-IRES-mCherry Plasmid | Lentiviral vector for co-expression of Piezo1 and mCherry reporter. | Addgene #80951 (mouse), #80952 (human) |
| Lenti-X 293T Cells | High-titer lentivirus production cell line. | Takara Bio #632180 |
| Yoda1 | Small molecule Piezo1-specific agonist; positive control for function. | Tocris #5586 |
| GsMTx-4 | Peptide toxin, selective Piezo1 channel blocker; negative control. | Alomone Labs STG-100 |
| Anti-Piezo1 Antibody (Extracellular) | For flow cytometry or live-cell staining of surface Piezo1. | Proteintech 15939-1-AP |
| ssODN HDR Donor Template | Single-stranded oligo DNA donor for precise CRISPR knock-in. | IDT Ultramer DNA Oligo |
| Opto-Piezo1 Construct (LOV2-Piezo1) | Plasmid for light-gated Piezo1 channel expression. | Addgene #201564 |
| Fluo-4 AM, Calcium Indicator | Cell-permeable dye for ratiometric Ca2+ imaging post-activation. | Thermo Fisher F14201 |
| Recombinant M-CSF | For differentiation of primary mouse bone marrow to macrophages. | PeproTech 315-02 |
| Polybrene (Hexadimethrine Bromide) | Enhances viral transduction efficiency by neutralizing charge repulsion. | Sigma-Aldrich TR-1003-G |
1. Introduction Within the thesis exploring Piezo1 channel activation in immune cells, direct mechanical stimulation (e.g., poking, shear stress) is a primary method. This document details complementary, physiologically relevant strategies for indirect activation by engineering the cellular microenvironment. By modulating substrate stiffness (elastic modulus) and micro/nano-topography, researchers can control the cytoskeletal forces and focal adhesion dynamics that ultimately gate Piezo1 channels. These approaches are critical for mimicking in vivo tissue contexts—from soft lymphoid organs to stiff atherosclerotic plaques or fibrotic tissue—and for high-throughput drug screening targeting mechanosensitive immune responses.
2. Key Quantitative Data Summary
Table 1: Substrate Stiffness Ranges for Immune Cell Mechanobiology Studies
| Cell Type | Substrate Material | Stiffness Range (kPa) | Key Piezo1/Functional Response |
|---|---|---|---|
| Naïve T Lymphocytes | Polyacrylamide (PAA) Gels | 0.5 - 3 kPa | Enhanced activation & IL-2 production on physiologic (~1 kPa) stiffness. |
| Macrophages (M0) | Polydimethylsiloxane (PDMS) | 1 - 100 kPa | Increased pro-inflammatory (M1) polarization on stiff substrates (>20 kPa). |
| Dendritic Cells | PEG-Based Hydrogels | 5 - 50 kPa | Improved antigen presentation & migration on intermediate stiffness. |
| Neutrophils | Collagen-Coated Gels | 2 - 16 kPa | Increased traction forces and NETosis on stiff substrates. |
Table 2: Topographical Feature Dimensions for Immune Cell Studies
| Topography Type | Typical Dimensions (Height/Depth x Diameter/Width x Spacing) | Cell Type Studied | Observed Mechanoresponse |
|---|---|---|---|
| Micropillars | 2 µm x 1 µm x 2 µm (H x D x S) | T Cells | Aligned cytoskeleton; modulated calcium flux. |
| Nanogratings | 300 nm x 500 nm x 500 nm (H x W x S) | Macrophages | Altered cell elongation; modified TNF-α secretion. |
| Microgrooves | 5 µm x 5 µm x 10 µm (D x W x S) | Dendritic Cells | Guided migration; altered podosome formation. |
| Random Nanofibers | Fiber Diameter: 200-500 nm | Neutrophils | Enhanced extravasation-like squeezing and activation. |
3. Experimental Protocols
Protocol 3.1: Fabricating Stiffness-Tunable Polyacrylamide (PAA) Hydrogels for Immune Cell Culture Objective: To create UV-adherent, protein-coated hydrogels with defined elastic moduli for studying stiffness-dependent Piezo1 activity. Materials: Acrylamide (40%), Bis-acrylamide (2%), PBS, 0.1 M NaOH, 3-Aminopropyltrimethoxysilane (APTMS), 0.5% Glutaraldehyde, Acrylamide/Bis-acrylamide mixes (see Table 3), Sulfo-SANPAH, Rat Tail Collagen I (50 µg/mL). Procedure:
- Coverslip Silanization: Clean glass coverslips. Incubate in 0.1 M NaOH for 5 min, rinse. Incubate in 2% APTMS in acetone for 5 min, rinse with acetone and water. Bake at 110°C for 1 hr.
- Hydrogel Solution Preparation: Prepare mixes for desired stiffness (e.g., 1 kPa: 5% Acrylamide, 0.1% Bis; 20 kPa: 10% Acrylamide, 0.5% Bis). Add 1/100 volume of 10% APS and TEMED to polymerize.
- Gel Polymerization: Pipette 20 µL of mix onto a silanized coverslip. Immediately cover with a hydrophobic-treated coverslip. Polymerize for 10-15 min at RT. Carefully separate coverslips.
- Protein Functionalization: Wash gels in PBS. Add 50 µL of 0.5 mg/mL Sulfo-SANPAH in PBS under UV light (365 nm) for 10 min. Wash, then incubate with 50 µg/mL Collagen I in PBS overnight at 4°C.
- Cell Seeding: Wash gels with PBS. Seed immune cells (e.g., 50,000 cells/cm²) in serum-free media for 30 min before adding complete media.
Protocol 3.2: Replicating Microtopographical Substrates via Soft Lithography Objective: To produce polydimethylsiloxane (PDMS) substrates with defined micropillar arrays for immune cell topography studies. Materials: Silicon master wafer (with topography), PDMS Sylgard 184, Trichloro(1H,1H,2H,2H-perfluorooctyl)silane, PBS, Pluronic F-127, Fibronectin. Procedure:
- Master Silanization: Vapor-phase silanize the silicon master wafer for 1 hr to facilitate PDMS release.
- PDMS Casting: Mix PDMS base and curing agent (10:1 w/w). Degas. Pour over master, cure at 65°C for 4+ hrs.
- Substrate Preparation: Peel PDMS from master, cut to size. Sterilize in 70% ethanol, dry, and treat with oxygen plasma for 1 min.
- Anti-Fouling & Coating: Incubate in 0.2% Pluronic F-127 for 30 min to prevent non-specific adhesion. Rinse. Incubate with 10 µg/mL Fibronectin in PBS for 2 hrs at 37°C.
- Cell Seeding: Rinse with PBS. Seed cells at low density (10,000 cells/cm²) to allow individual cell-topography interaction.
4. Signaling Pathway & Experimental Workflow Diagrams
Diagram Title: Signaling from Microenvironment to Piezo1 Activation
Diagram Title: Experimental Workflow for Microenvironment Studies
5. The Scientist's Toolkit: Research Reagent Solutions
Table 3: Essential Materials for Microenvironment Mechanobiology
| Item Name | Supplier Examples | Function & Application Note |
|---|---|---|
| Polyacrylamide (40%) | Bio-Rad, Sigma-Aldrich | Monomer for creating tunable-stiffness hydrogel substrates. Critical for Protocol 3.1. |
| Sylgard 184 PDMS Kit | Dow, Ellsworth Adhesives | Silicone elastomer for fabricating topographical substrates via soft lithography (Protocol 3.2). |
| Sulfo-SANPAH | Thermo Fisher | Heterobifunctional crosslinker for covalently linking proteins to PAA hydrogel surfaces. |
| Cytoskeletal Drugs (Y-27632, Latrunculin A) | Tocris, Sigma | Inhibitors of ROCK (Y-27632) and Actin Polymerization (Lat A). Used to probe mechanism. |
| Piezo1 Inhibitor (GsMTx4) | Alomone Labs, Tocris | Selective peptide inhibitor to confirm Piezo1-specific roles in observed calcium signaling. |
| Fluo-4 AM Calcium Dye | Thermo Fisher, Abcam | Cell-permeable fluorescent dye for live-cell imaging of Piezo1-mediated calcium influx. |
| Collagen I, Rat Tail | Corning, MilliporeSigma | Standard extracellular matrix protein for coating substrates to promote integrin-mediated adhesion. |
| Pluronic F-127 | Sigma-Aldrich | Non-ionic surfactant used to block non-specific cell adhesion on hydrophobic PDMS surfaces. |
This article presents detailed application notes and protocols for the study of Piezo1, a critical mechanosensitive ion channel, in key immune cells. These methods are framed within the broader thesis that precise Piezo1 activation is a pivotal regulator of immune cell function, offering novel targets for immunomodulation in drug development.
Piezo1 Activation in T Cell Proliferation & Cytokine Profiling
Thesis Context: Mechanical cues from stiffened tissues or vascular shear stress can activate Piezo1 in T cells, influencing their activation threshold, differentiation, and effector functions. This protocol measures proliferative and cytokine responses to controlled Piezo1 agonism.
Experimental Protocol: Yoda1-Mediated Activation and Functional Readout in Human Primary CD4+ T Cells
Day 0: Cell Isolation & Stimulation
- Isolate human CD4+ T cells from PBMCs using a negative selection magnetic bead kit.
- Plate cells at 2 x 10⁵ cells/well in a 96-well U-bottom plate in complete RPMI-1640 medium.
- Prepare conditions in quadruplicate:
- Control: Media only.
- Subthreshold CD3/CD28: Anti-CD3 (1 µg/mL, plate-bound) + Anti-CD28 (0.1 µg/mL, soluble).
- Subthreshold CD3/CD28 + Yoda1: As above + Piezo1 agonist Yoda1 (5 µM).
- Full Activation (Positive Control): Anti-CD3 (5 µg/mL) + Anti-CD28 (2 µg/mL).
- Incubate at 37°C, 5% CO₂ for 72 hours.
Day 3: Proliferation & Cytokine Assay
- Proliferation: Gently resuspend cells from two replicate wells. Transfer 100 µL to a new plate for analysis via ATP-based luminescent cell viability assay (e.g., CellTiter-Glo).
- Cytokine Analysis: Centrifuge the remaining two replicate plates at 300 x g for 5 min. Collect 100 µL of supernatant per well.
- Quantify IFN-γ and IL-2 using a multiplex electrochemiluminescence (MSD) or high-sensitivity ELISA kit per manufacturer instructions.
Quantitative Data Summary: Table 1: T Cell Response to Piezo1 Agonism (Representative Data)
| Condition | Relative Luminescence (Proliferation) | IFN-γ (pg/mL) | IL-2 (pg/mL) |
|---|---|---|---|
| Media Control | 1.0 ± 0.2 | 5 ± 3 | 10 ± 5 |
| Subthreshold CD3/CD28 | 2.5 ± 0.4 | 85 ± 15 | 210 ± 40 |
| Subthreshold CD3/CD28 + Yoda1 (5 µM) | 8.1 ± 1.2 | 450 ± 75 | 980 ± 120 |
| Full CD3/CD28 Activation | 15.3 ± 2.1 | 1250 ± 200 | 2550 ± 350 |
Diagram: Piezo1 Signaling in T Cell Activation
Piezo1 Modulation in Macrophage Phagocytosis & Polarization
Thesis Context: Piezo1 senses extracellular matrix stiffness, directing macrophage polarization towards pro-inflammatory (M1) or anti-inflammatory (M2) phenotypes. This protocol assesses phagocytic capacity and marker expression upon Piezo1 modulation.
Experimental Protocol: Phagocytosis Assay and Phenotyping of BMDMs with Yoda1 and GsMTx4
Day -7: Bone Marrow-Derived Macrophage (BMDM) Differentiation
- Flush bone marrow from murine femurs and tibias.
- Culture cells in Petri dishes with complete DMEM + 20% L929-conditioned medium (source of M-CSF) for 7 days.
Day 0: Treatment and Phagocytosis Assay
- Seed differentiated BMDMs in a 24-well plate at 1 x 10⁵ cells/well.
- Pre-treat cells for 2 hours:
- Control: DMSO (0.1% v/v).
- Piezo1 Agonist: Yoda1 (10 µM).
- Piezo1 Inhibitor: GsMTx4 (5 µM).
- Add pHrodo Red E. coli BioParticles (10 µg/mL) to each well.
- Incubate for 90 minutes at 37°C.
- Wash cells with cold PBS, detach, and analyze by flow cytometry. Measure fluorescence in the PE/APC channel (phagocytosis) and stain for surface markers (F4/80, CD86 for M1, CD206 for M2).
Quantitative Data Summary: Table 2: Macrophage Function Following Piezo1 Modulation (Representative Data)
| Condition | % Phagocytic Cells (vs. Control) | MFI of CD86 (M1) | MFI of CD206 (M2) |
|---|---|---|---|
| Control (DMSO) | 100% | 1,000 ± 150 | 2,500 ± 300 |
| Yoda1 (10 µM) | 165% ± 18% | 2,800 ± 400 | 1,100 ± 200 |
| GsMTx4 (5 µM) | 62% ± 10% | 600 ± 100 | 4,200 ± 500 |
Diagram: Piezo1 Role in Macrophage Mechanosignaling
Piezo1 in Dendritic Cell Migration and Antigen Presentation
Thesis Context: Dendritic cell (DC) migration through confined lymphatic spaces requires Piezo1-mediated sensing of physical constraints. This protocol evaluates DC chemotaxis and T cell priming efficiency under Piezo1 inhibition.
Experimental Protocol: Transwell Migration and Allogeneic T Cell Activation Assay
Part A: DC Migration Assay
- Differentiate human monocyte-derived DCs (moDCs) with IL-4 and GM-CSF for 6 days.
- Pre-treat mature moDCs (LPS-matured) for 1 hour with DMSO (Ctrl) or GsMTx4 (5 µM).
- Place 2 x 10⁵ cells in the top chamber of a 5.0 µm pore transwell insert. Add CCL19 (200 ng/mL) to the bottom chamber as a chemokine.
- Incubate for 4 hours at 37°C. Collect cells from the bottom chamber and count using a flow cytometer or hemocytometer. Calculate % migrated.
Part B: Antigen Presentation & T Cell Priming
- Use the same pre-treated moDCs from Step A.2.
- Load moDCs with superantigen SEB (1 µg/mL) for 2 hours.
- Co-culture SEB-loaded moDCs with allogeneic CFSE-labeled CD4+ T cells at a 1:10 ratio (DC:T cell) in a 96-well round-bottom plate.
- After 5 days, analyze T cell proliferation by CFSE dilution via flow cytometry.
Quantitative Data Summary: Table 3: Dendritic Cell Function with Piezo1 Inhibition (Representative Data)
| Condition (moDC Treatment) | % Migration to CCL19 | % Proliferated Allogeneic CD4+ T Cells |
|---|---|---|
| Control (DMSO) | 100% | 68% ± 7% |
| GsMTx4 (5 µM) | 45% ± 8% | 32% ± 6% |
The Scientist's Toolkit: Research Reagent Solutions
| Reagent/Catalog # (Example) | Function in Piezo1 Immune Research |
|---|---|
| Yoda1 (Tocris, #5586) | Selective small molecule agonist of Piezo1 channels. Used to mimic mechano-activation. |
| GsMTx4 (Tocris, #4912) | Peptide inhibitor selective for cationic mechanosensitive channels, including Piezo1. |
| pHrodo Red E. coli BioParticles (Invitrogen, #P35361) | pH-sensitive phagocytosis probe; fluorescence increases in acidic phagolysosomes. |
| CellTiter-Glo Luminescent Assay (Promega, #G7571) | Quantifies ATP as a proxy for metabolically active, proliferating cells. |
| Mouse Anti-Human CD3/CD28 T Activator (Stemcell, #10971) | Provides specific, subthreshold or full TCR stimulation for synergy experiments. |
| Recombinant Human GM-CSF & IL-4 (PeproTech) | Critical cytokines for differentiating monocytes into immature dendritic cells. |
| MSD Multi-Spot Cytokine Assay Kits (Meso Scale Discovery) | Enables sensitive, multiplex quantification of secreted cytokines from small sample volumes. |
Overcoming Challenges: Optimizing Piezo1 Activation Assays and Data Reproducibility
Application Notes: Key Pitfalls in Piezo1 Agonist Use in Immunology
Agonists for Piezo1, such as Yoda1 and Jedi1/2, are crucial tools for probing mechanosensitive ion channel function in immune cells like T cells, macrophages, and dendritic cells. However, their application is fraught with specific challenges that can compromise data integrity.
Concentration Dependence and Biphasic Effects
Piezo1 agonists exhibit a sharp concentration-response curve. Sub-optimal concentrations fail to elicit robust Ca²⁺ influx, while supra-optimal concentrations can induce cellular stress, loss of viability, or paradoxical inhibition. This is particularly critical in immune cells where Piezo1 activation modulates cytokine secretion, migration, and phagocytosis.
Table 1: Characterized Concentration Effects of Common Piezo1 Agonists on Immune Cells
| Agonist | Optimal In Vitro Range (Immune Cells) | Supra-Optimal Effect (>2x Optimal) | Key Immune Cell Phenotype Reported (Optimal Range) | Primary Reference |
|---|---|---|---|---|
| Yoda1 | 5 – 20 µM | Cytotoxicity, membrane disruption, non-specific cation influx | Enhanced T cell activation & migration; Macrophage IL-6 secretion | Syeda et al., 2015; Jairaman et al., 2021 |
| Jedi1 | 10 – 30 µM | Reduced specificity, off-target TRP channel activation | Altered dendritic cell maturation profile | Wang et al., 2018 |
| Jedi2 | 1 – 10 µM | Rapid desensitization, impaired long-term Ca²⁺ signaling | Potentiation of macrophage bacterial clearance | Evans et al., 2018 |
| Dooku1 | 10 – 50 µM (Antagonist) | Partial agonist activity at high concentrations | Inhibition of Yoda1-induced monocyte adhesion | Lacroix et al., 2018 |
Off-Target Effects and Specificity
Yoda1 is reported to modulate other ion channels (e.g., TRPV4, TRPC1) at concentrations near its effective Piezo1-activating range. Jedi compounds show improved specificity but may still affect mitochondrial function. Validation via genetic knockout (Piezo1-KO) or RNAi is non-negotiable.
Table 2: Documented Off-Target Effects of Piezo1 Agonists
| Agonist | Suspected Off-Target | Evidence/Assay | Mitigation Strategy |
|---|---|---|---|
| Yoda1 | TRPV4, TRPC1, General membrane fluidizer | Ca²⁺ flux in Piezo1^-/- cells; Electrophysiology in TRPV4-expressing cells. | Use Piezo1^-/- controls; Employ Jedi analogs; Limit use to ≤20µM. |
| Jedi1 | Mitochondrial permeability transition pore (mPTP) | Loss of ΔΨm in presence of cyclosporin A (mPTP inhibitor). | Co-apply mPTP inhibitors (e.g., cyclosporin A) in long-term assays. |
| Yoda1/Jedi | Chemical reactivity (thiol modification) | Activity blocked by reducing agents like DTT. | Include DTT controls; use fresh, DMSO stocks. |
Solubility and Vehicle Issues
These agonists are highly hydrophobic, requiring DMSO or other organic solvents. Final DMSO concentrations >0.5% v/v can independently alter immune cell function. Precipitation in aqueous buffers is common, leading to inconsistent effective concentrations.
Table 3: Solubility and Preparation Guidelines
| Compound | Stock Solvent | Max Stock Conc. | Buffer Compatibility Notes | Max Final [DMSO] Recommended |
|---|---|---|---|---|
| Yoda1 | DMSO (dry) | 50 mM | Precipitates in PBS/RPMI; add from stock directly to well with mixing. | 0.2% |
| Jedi1 | DMSO | 30 mM | Better solubility than Yoda1; still requires vortexing before dilution. | 0.3% |
| Dooku1 | DMSO | 100 mM | Stable in buffer for short periods. | 0.5% |
Detailed Experimental Protocols
Protocol: Validating Piezo1 Agonist Specificity in Primary Murine Macrophages
Objective: To confirm that observed Ca²⁺ flux from an agonist is Piezo1-dependent.
Materials: See "The Scientist's Toolkit" below. Workflow:
- Cell Preparation: Differentiate bone-marrow-derived macrophages (BMDMs) from wild-type (WT) and Piezo1 conditional knockout mice (LysM-Cre x Piezo1^fl/fl) for 7 days in M-CSF.
- Dye Loading: Load cells with 5 µM Fura-2 AM in imaging buffer (HBSS with 10 mM HEPES, 2 mM CaCl₂) for 45 min at 37°C. Wash and rest for 15 min.
- Agonist Preparation:
- Prepare 10x concentrated agonist solutions in DMSO. Ensure no precipitation.
- Prepare a vehicle control (DMSO only) at the same final concentration (e.g., 0.2%).
- Pre-warm all solutions to 37°C.
- Calcium Imaging:
- Acquire baseline ratio (340/380 nm) for 60 sec.
- Manually add 10x agonist/vehicle directly to the well while mixing gently. Record ratio for 5-10 min.
- Apply ionomycin (5 µM) as a positive control for Ca²⁺ influx.
- Data Analysis:
- Calculate ΔF/F0 or area under the curve (AUC) for the first 120 sec post-addition.
- Compare WT response (agonist vs. vehicle) to confirm activity.
- Compare agonist response in WT vs. Piezo1^-/- cells. A response abolished in KO cells confirms specificity.
Protocol: Optimizing Agonist Concentration for T Cell Functional Assays
Objective: To determine the non-cytotoxic, effective concentration range for Yoda1 in modulating T cell activation.
Materials: See "The Scientist's Toolkit." Workflow:
- Dose-Response & Viability:
- Isolate naive CD4+ T cells. Plate in 96-well plates pre-coated with anti-CD3 (1 µg/mL).
- Add titrated Yoda1 (0.5, 2, 5, 10, 20, 50 µM) or DMSO control. Include wells with anti-CD28 (2 µg/mL) for full activation control.
- After 48h, measure viability using flow cytometry (Annexin V / PI staining) and metabolic activity (MTT or Resazurin assay).
- Threshold: Choose the highest concentration showing <10% reduction in viability vs. DMSO control.
- Functional Readout (Cytokine Secretion):
- Repeat stimulation with anti-CD3 plus Yoda1 at concentrations passing the viability screen.
- Collect supernatant at 24h (IL-2) and 72h (IFN-γ).
- Quantify cytokines by ELISA or multiplex bead array.
- Analysis: Plot cytokine concentration vs. [Yoda1]. The optimal concentration is at the plateau of cytokine secretion before any decline.
Diagrams
Title: Piezo1 Agonist Validation Workflow
Title: Piezo1 Signaling in Macrophage Activation
The Scientist's Toolkit: Key Research Reagent Solutions
Table 4: Essential Materials for Piezo1 Agonist Studies in Immune Cells
| Reagent/Material | Function & Rationale | Example Product/Catalog # (Representative) |
|---|---|---|
| Selective Piezo1 Agonists | Pharmacological activation of Piezo1 channels. Jedi series offer improved specificity over Yoda1. | Yoda1 (Tocris, 5586); Jedi2 (Sigma, SML2650) |
| Piezo1 Genetic Models | Gold-standard for validating agonist specificity and studying native function. | Piezo1 floxed mice (Jackson Lab); CRISPR/Cas9 knockout cell lines. |
| Calcium-Sensitive Dyes | Real-time measurement of Piezo1-mediated Ca²⁺ influx. Ratiometric dyes (Fura-2) are preferred. | Fura-2 AM (Invitrogen, F1221); Fluo-4 AM (Invitrogen, F14201) |
| Low-Binding Microplates/Tubes | Minimizes loss of hydrophobic agonists due to adsorption to plastic surfaces. | Corning Costar Ultra-Low Attachment plates; LoBind Eppendorf tubes. |
| Anhydrous DMSO | Stable, water-free solvent for preparing high-concentration agonist stocks, preventing hydrolysis. | Sigma-Aldrich, D8418 |
| Cell Viability Assay Kits | Critical for determining non-cytotoxic agonist concentration ranges. | Annexin V/PI Apoptosis Kit (BioLegend); CellTiter-Glo (Promega). |
| Piezo1 Antibodies (Validated) | For confirming protein expression, especially after genetic manipulation. | Anti-Piezo1 (Alomone Labs, APC-101); Anti-Piezo1 (Proteintech, 15939-1-AP) |
| TRP Channel Inhibitors | Control compounds to rule out common off-target effects (e.g., GSK2193874 for TRPV4). | GSK2193874 (TRPV4 inhibitor, Tocris, 4907) |
| Mechanical Stimulation Device | To correlate pharmacological activation with native mechanical activation (e.g., shear stress). | Ibidi pump systems; Cell stretching devices (Flexcell). |
Within the broader thesis investigating Piezo1 channel activation in immune cells (e.g., T cells, macrophages, dendritic cells), standardized mechanical stimulation is paramount. Discrepancies in calibration and control setups lead to non-reproducible channel gating data, confounding the interpretation of downstream Ca²⁺ signaling, cytokine production, and migratory behaviors. These Application Notes provide a framework for rigorous, artifact-minimized mechanostimulation to study immune cell mechanobiology.
Core Principles of Calibration & Control
Calibration translates applied voltage to a quantifiable mechanical output (e.g., indentation force, pressure, strain). Control Setup must account for system drift, environmental noise, and non-mechanical artifacts (e.g., thermal, electrical). Minimizing Artifacts requires identifying and eliminating confounding signals that mimic or obscure genuine Piezo1-mediated responses.
Table 1: Common Mechanical Stimulation Modalities for Immune Cell Research
| Modality | Typical Stimulus Range | Measured Output | Key Artifact Sources | Relevant Immune Cell Types |
|---|---|---|---|---|
| Substrate Stretch (Biaxial/Uniaxial) | 1-20% Strain, 0.1-2 Hz | Substrate Strain (%) | Substrate Fluorescence, Media Movement | Macrophages, T cells |
| Atomic Force Microscopy (AFM) Indentation | 50-500 pN, 0.5-10 µm/s | Force (pN), Indentation (nm) | Tip Adhesion, Thermal Drift | Dendritic Cells, Neutrophils |
| Pressure-driven Flow (Shear Stress) | 0.1-10 dyn/cm² | Wall Shear Stress (dyn/cm²) | Temperature Gradient, Bubble Formation | Lymphocytes, Monocytes |
| Piezoelectric Actuator (Local Probe) | 0-10 V, 0.1-5 µm Displacement | Probe Displacement (µm) | Capacitive Coupling, Vibration Noise | Mast Cells, B cells |
| Acoustic Stimulation (US) | 0.1-1 MPa Pressure, 1-10 MHz | Acoustic Pressure (MPa) | Cavitation, Thermal Effects | Macrophages |
Table 2: Typical Piezo1 Activation Thresholds & Common Artifacts
| Cell Type | Approx. Activation Threshold (Est.) | Common Concurrent Artifact | Suggested Control Experiment |
|---|---|---|---|
| Naïve T Cell | ~10-15% Substrate Strain | Stretch-induced TCR clustering | Use Piezo1 inhibitor (GsMTx-4) + strain. |
| Macrophage (M0) | ~5-8 dyn/cm² Shear Stress | Flow-mediated cytokine washout | Static condition with perfused agonist. |
| Dendritic Cell | 200-400 pN (AFM) | Tip pressure triggering other MS channels | Calibrate on inert material (e.g., PDMS pillar). |
| Lymphocyte (in suspension) | 0.3-0.5 MPa (Acoustic) | US-induced membrane poration | Include membrane integrity dye (e.g., PI). |
Detailed Experimental Protocols
Protocol 1: Calibrating a Piezoelectric Actuator for Localized Cell Poking
Objective: To relate input voltage to actuator displacement and resulting cellular force for Piezo1 activation studies. Materials: Piezoelectric actuator with probe, Inverted Microscope, High-speed camera, Fluorescent beads (0.5 µm), Calibrated stiffness reference cantilever (e.g., 0.1 N/m), Culture dish with immune cells. Procedure:
- Displacement Calibration:
- Attach a single fluorescent bead to the actuator probe tip.
- Apply a voltage ramp (e.g., 0-10 V, 1 V steps) under the microscope.
- Record high-speed images (≥500 fps) at each step.
- Use particle tracking software to plot Voltage vs. Displacement (µm). Fit a linear regression to derive the displacement constant (µm/V).
- Force Calibration:
- Replace the sample with the calibrated reference cantilever.
- Drive the actuator at a known displacement (from Step 1) until it contacts and bends the cantilever.
- Record the cantilever deflection (∆d in m).
- Calculate applied force: F = k * ∆d, where k is the cantilever's spring constant.
- Repeat across the displacement range to create a Force vs. Voltage lookup table.
- System Validation:
- Plate immune cells on a soft (∼1 kPa) substrate.
- Position the probe adjacent to the cell soma.
- Apply a stimulus protocol (e.g., 5 V step, 1 s). Use the lookup table to report the applied force.
- Simultaneously image intracellular Ca²⁺ (e.g., Fluo-4 AM) to correlate force with Piezo1 activation.
Protocol 2: Substrate Stretch System Calibration & Artifact Minimization
Objective: To apply uniform, calibrated biaxial stretch to adherent immune cells while controlling for imaging artifacts. Materials: Commercially available stretchable silicone chamber, Biaxial stretcher, Fluorescent fiduciary markers (e.g., 1 µm beads), Ca²⁺-insensitive fluorescent dye (e.g., CellTracker Red), Piezo1 KO or inhibitor control. Procedure:
- Strain Field Validation:
- Coat the stretchable membrane with a thin layer of fluorescent beads.
- Apply increments of nominal strain (e.g., 5%, 10%, 15%).
- Acquire widefield images of the bead layer pre- and post-stretch.
- Use digital image correlation (DIC) software to compute the actual strain field across the entire imaging area. Verify uniformity (>90%).
- Control for Motion & Focus Artifacts:
- Seed cells and load with both a Ca²⁺ indicator (Fluo-4, Green) and a Ca²⁺-insensitive cytoplasmic dye (CellTracker Red, Far Red).
- During stretch, simultaneously record both fluorescence channels.
- Analysis: Calculate ∆F/F0 for Fluo-4. Use the Red channel signal to identify and correct for any fluorescence changes due solely to cell movement or deformation (e.g., by subtraction or ratiometric analysis).
- Piezo1-Specific Response Isolation:
- Run identical stretch experiments on two conditions: (a) Wild-type cells, (b) Cells pre-treated with 5 µM GsMTx-4 (Piezo1 inhibitor) for 10 minutes.
- The difference in Ca²⁺ response between (a) and (b) constitutes the Piezo1-specific component.
Protocol 3: Controlling for Electrical Artifacts in Piezo-Driven Systems
Objective: To isolate mechanical from electrical artifacts when using high-voltage piezoelectric devices. Materials: Piezo actuator, Shielded leads, Grounded Faraday cage, Microscope with electrical isolation, Ca²⁺ imaging setup, "Dummy" electrochemical cell. Procedure:
- Setup Isolation:
- Enclose the entire stimulation and imaging setup in a grounded Faraday cage.
- Use shielded cables for all electrical connections, with shields grounded at one point.
- Electrically isolate the microscope stage from the piezo driver ground.
- Artifact Quantification with a "Dummy" Cell:
- Create a passive electrical model of a cell: a 10 MΩ resistor in parallel with a 100 pF capacitor immersed in standard bath solution.
- Place this "dummy cell" in the stimulation setup.
- Apply the standard piezo voltage protocol while recording any induced current or voltage in the dummy circuit using a patch-clamp amplifier or sensitive voltmeter. This measures the direct electrical artifact.
- Experimental Correction:
- In live-cell experiments, any immediate (sub-millisecond) response in the Ca²⁺ indicator that mirrors the artifact profile measured in Step 2 should be considered non-biological and subtracted or ignored.
- The true Piezo1-mediated Ca²⁺ influx typically has a latency of several milliseconds post-stimulus onset.
Signaling Pathways & Workflows
Piezo1 Mechanotransduction in Immune Cells
Workflow for Artifact Minimized Mechanostimulation
The Scientist's Toolkit: Research Reagent Solutions
Table 3: Essential Materials for Standardized Mechanostimulation Studies
| Item | Function/Description | Example Product/Catalog |
|---|---|---|
| GsMTx-4 | Selective inhibitor of Piezo1 channels. Critical negative control for establishing Piezo1-specific effects. | Tocris Bioscience (4566) |
| Yoda1 | Chemical agonist of Piezo1. Positive control for channel activity independent of mechanical stimulation. | Sigma-Aldrich (SML1558) |
| Fluo-4 AM | Cell-permeant, ratiometric calcium indicator. Gold standard for imaging Ca²⁺ influx upon Piezo1 activation. | Thermo Fisher Scientific (F14201) |
| CellTracker Red CMTPX | Cytoplasmic dye insensitive to Ca²⁺. Used to control for motion artifacts during stretch or flow. | Thermo Fisher Scientific (C34552) |
| PDMS (Sylgard 184) | Silicone elastomer for fabricating tunable stiffness substrates and stretchable membranes. | Dow Chemical |
| Fluorescent Microspheres (0.5-1 µm) | Fiduciary markers for calibrating strain fields and tracking displacement in fluid flow. | Thermo Fisher Scientific (F8803/F13081) |
| Piezo1 shRNA Lentivirus | For genetic knockdown of Piezo1 to create isogenic negative control cell lines. | Santa Cruz Biotechnology (sc-156268-V) |
| Calibration Cantilever | AFM cantilever of known spring constant for force calibration of probes. | Bruker (MLCT-BIO-DC) |
Application Notes
Piezo1, a mechanically activated cation channel, is a critical regulator of immune cell function. However, its study is complicated by significant cell-type-specific variations in expression levels and functional interactions with co-receptors. These considerations are paramount for designing physiologically relevant experiments and for developing potential immunomodulatory therapies targeting Piezo1.
In innate immune cells like macrophages, Piezo1 expression is robust and modulates phagocytosis, cytokine secretion, and migration in response to matrix stiffness and shear stress. In contrast, baseline Piezo1 expression in resting T lymphocytes is often lower but can be dynamically upregulated upon activation, influencing mechanosensing at the immune synapse. Key co-receptor interactions further diversify Piezo1's functional outcomes. For example, in dendritic cells, integrin engagement can co-cluster with and potentiate Piezo1 activity, while in certain T cell subsets, crosstalk with the T cell receptor (TCR) complex can modulate calcium signaling thresholds.
The quantitative data below summarizes these cell-type-specific differences, which must inform the selection of appropriate cellular models, stimulation parameters, and readout assays.
Table 1: Piezo1 Expression and Function in Primary Immune Cells
| Immune Cell Type | Relative Piezo1 mRNA (RPKM) | Key Functional Role | Primary Co-receptor/Interactor | Key Cytokine/Output Affected |
|---|---|---|---|---|
| Monocyte/Macrophage | 15.2 - 22.5 | Phagocytosis, Stiffness Sensing | β1 Integrin | IL-6, TNF-α |
| Conventional Dendritic Cell (cDC1) | 18.8 - 25.1 | Antigen Uptake, Migration | CD11b/CD18 (Mac-1) | IL-12, CXCL10 |
| CD4+ Naive T Cell | 2.1 - 5.5 | Activation Threshold | T Cell Receptor (TCR) | IL-2, IFN-γ |
| Regulatory T Cell (Treg) | 4.8 - 7.3 | Suppressive Function | Unknown | TGF-β, IL-10 |
| Neutrophil | 8.5 - 12.3 | Transendothelial Migration | PSGL-1 | ROS Production |
Table 2: Common Pharmacologic & Genetic Piezo1 Modulators
| Reagent Name | Type | Effect on Piezo1 | Common Use Concentration | Cell-Type Specific Note |
|---|---|---|---|---|
| Yoda1 | Agonist | Potentiator/Activator | 1 - 10 µM | More potent in myeloid vs. lymphoid cells. |
| GsMTx4 | Inhibitor | Pore blocker | 1 - 5 µM | Broad-spectrum, also blocks Piezo2. |
| Dooku1 | Antagonist | Yoda1 antagonist | 5 - 20 µM | Efficacy depends on Yoda1 binding site occupancy. |
| Piezo1-siRNA | Genetic Knockdown | mRNA degradation | 10-50 nM transfection | Transfection efficiency varies greatly by cell type. |
| Piezo1-CRISPR/Cas9 | Genetic Knockout | Gene disruption | N/A | Essential in some macrophages, may affect viability. |
Experimental Protocols
Protocol 1: Assessing Cell-Type Specific Piezo1 Surface Expression by Flow Cytometry
Objective: To quantify relative Piezo1 protein expression on the surface of different primary immune cells. Materials: Freshly isolated PBMCs or immune cell subsets, anti-human Piezo1 extracellular antibody (e.g., clone N/A), isotype control, flow cytometry buffer (PBS + 2% FBS), fixation buffer (4% PFA). Procedure:
- Isolate immune cell subsets (e.g., using CD14+ magnetic beads for monocytes, CD3+ for T cells) to >90% purity.
- Aliquot 0.5-1 x 10^6 cells per sample into FACS tubes. Include unstained and isotype controls.
- Wash cells twice with cold flow buffer. Centrifuge at 300 x g for 5 min.
- Resuspend cell pellet in 100 µL flow buffer containing the anti-Piezo1 antibody (1:100 dilution) or matched isotype. Incubate for 45 min at 4°C in the dark.
- Wash cells twice with 2 mL cold flow buffer.
- Fix cells with 200 µL of 4% PFA for 15 min at 4°C (optional, for biosafety).
- Wash once, resuspend in 300 µL flow buffer, and analyze immediately on a flow cytometer.
- Use Median Fluorescence Intensity (MFI) of the live cell gate, subtracting isotype control MFI, for cross-comparison.
Protocol 2: Functional Calcium Flux Assay with Co-receptor Co-Stimulation
Objective: To measure Piezo1-mediated calcium influx in real-time while engaging a putative co-receptor. Materials: Immune cells, FLIPR Calcium 6 dye (or equivalent), HEPES-buffered physiological saline, Piezo1 agonist (Yoda1), co-receptor ligand (e.g., ICAM-1 for LFA-1), flat-bottom 96-well assay plates, fluorescent plate reader with kinetic capability. Procedure:
- Load cells with Calcium 6 dye according to manufacturer's instructions for 1 hour at 37°C.
- During dye loading, coat assay wells with co-receptor ligand (e.g., 5 µg/mL ICAM-1-Fc) or PBS control for 2 hours at 37°C, then block with 1% BSA.
- Wash dye-loaded cells and resuspend in HEPES-buffered saline. Add 100 µL cell suspension (~1x10^5 cells) to each prepared well.
- Place plate in pre-warmed (37°C) plate reader. Establish a 20-second baseline read.
- At time T=20s, automatically add 50 µL of 3X concentrated Yoda1 (final concentration 5 µM) or vehicle control to wells using the instrument's injector.
- Continue kinetic reading (Ex/Em ~490/525 nm) for an additional 100 seconds.
- Analyze the peak fluorescence intensity (F) normalized to baseline (F0) as ΔF/F0. Compare responses between co-receptor coated vs. uncoated wells.
The Scientist's Toolkit: Research Reagent Solutions
| Item | Function in Piezo1/Immune Cell Research |
|---|---|
| Anti-Piezo1 (Extracellular) Antibody | Detects surface expression via flow cytometry or imaging; clone specificity is critical. |
| Yoda1 (Agonist) | The standard small-molecule tool for specific, chemical activation of Piezo1 channels. |
| GsMTx4 (Inhibitor) | Tarantula venom-derived peptide that mechanically blocks the Piezo1 pore. |
| FLIPR Calcium Assay Kits | Optimized no-wash dyes for high-throughput kinetic measurement of Piezo1-mediated Ca2+ influx. |
| Polyacrylamide Hydrogels with Tunable Stiffness | To provide physiologically relevant mechanical substrates (0.5 - 50 kPa) for cell culture. |
| Laminar Flow System (e.g., Ibidi Pump) | Applies precise shear stress to study Piezo1 in endothelial or circulating immune cells. |
| Piezo1-floxed Mouse Model | Enables cell-type-specific Cre-mediated knockout to study function in vivo. |
Diagrams
Title: Piezo1 Pathways in Macrophage vs T Cell
Title: Piezo1 Expression & Function Workflow
Within the field of immune cell research, particularly for studying Piezo1 mechanosensitive ion channels, a multi-modal approach is essential. Piezo1 activation influences calcium signaling, membrane electrophysiology, and downstream functional responses like cytokine release and migration. Combining calcium imaging, electrophysiology, and functional assays provides a holistic view of channel activity and its physiological consequences. This application note details protocols and best practices for integrating these readouts to study Piezo1 in immune cells such as macrophages, T cells, and dendritic cells.
Table 1: Comparison of Integrated Readout Modalities for Piezo1 Research
| Modality | Primary Readout | Temporal Resolution | Throughput | Key Immune Cell Application | Typical Piezo1 Activator Used |
|---|---|---|---|---|---|
| Ratiometric Ca²⁺ Imaging | Fura-2 AM fluorescence ratio (340nm/380nm) | Milliseconds to seconds | Low to Medium | Real-time Ca²⁺ flux in single cells/microglia | Yoda1 (1-10 µM), mechanical stretch |
| Electrophysiology (Patch Clamp) | Membrane current (pA) or potential (mV) | Microseconds to milliseconds | Very Low | Direct PIEZO1 current recording in primary macrophages | Yoda1 (5 µM), pressure injection (-20 to -40 mmHg) |
| Secretion Assay (ELISA/MSD) | Cytokine concentration (pg/mL) | Hours | High | TNF-α, IL-6 release from monocytes post-activation | Substrate stiffness (≥10 kPa), Yoda1 |
| Migration/Transwell Assay | Cell count or % migrated | 2-24 hours | Medium | Dendritic cell chemotaxis | Laminar shear stress (0.5-5 dyn/cm²) |
| Flow Cytometry | Surface marker MFI or % positive cells | Minutes to hours | High | Integrin activation (CD11b) on neutrophils | Mechanical compression |
Table 2: Representative Data from Integrated Piezo1 Experiments
| Cell Type | Piezo1 Activator | Ca²⁺ Peak ΔR (340/380) | Peak Current Density (pA/pF) | Functional Output (vs. Control) |
|---|---|---|---|---|
| Primary Mouse Macrophages | Yoda1 (5 µM) | +0.45 ± 0.12 | +25.3 ± 5.1 | TNF-α: +350% |
| Human THP-1 Derived Macrophages | Substrate Stiffness (15 kPa) | +0.30 ± 0.08 | N/A | IL-1β: +220%; Migration: +180% |
| Mouse Dendritic Cells | Laminar Shear (2 dyn/cm²) | +0.60 ± 0.15 | N/A | CCR7 Expression: +3.1-fold |
Experimental Protocols
Protocol 1: Sequential Ratiometric Ca²⁺ Imaging and Electrophysiology in Single Macrophages
Objective: To correlate Piezo1-mediated calcium influx with direct mechanosensitive currents in the same cell.
Materials:
- Cells: Primary bone marrow-derived macrophages (BMDMs) cultured on poly-L-lysine coated glass coverslips.
- Dye: Fura-2 AM (2 µM in extracellular solution).
- Activator: Yoda1 (Tocris), prepared as 10 mM stock in DMSO.
- Solutions: Standard extracellular (140 mM NaCl, 5 mM KCl, 2 mM CaCl2, 1 mM MgCl2, 10 mM HEPES, 10 mM Glucose, pH 7.4). Internal pipette solution for whole-cell (130 mM CsCl, 10 mM HEPES, 5 mM EGTA, 1 mM MgCl2, pH 7.2).
Procedure:
- Cell Loading & Imaging Setup: Incubate BMDMs with Fura-2 AM for 30 min at 37°C. Wash and mount coverslip in imaging chamber on an inverted epifluorescence microscope. Perfuse with extracellular solution at 1 mL/min.
- Baseline Ca²⁺ Recording: Using a 40x objective, select a healthy, adherent cell. Record the 340 nm and 380 nm excitation fluorescence (510 nm emission) at 2 Hz for 1 minute to establish baseline ratio (R = F340/F380).
- Yoda1 Application & Ca²⁺ Response: Switch perfusion to solution containing 5 µM Yoda1. Record the fluorescence ratio for 5 minutes to capture the peak and plateau of the Ca²⁺ response.
- Transition to Patch Clamp: Carefully move the selected cell to the center of the field. Under visual guidance, approach the same cell with a borosilicate glass pipette (3-5 MΩ resistance). Establish a GΩ seal and break into whole-cell configuration.
- Electrophysiological Recording: In voltage-clamp mode (holding potential -60 mV), apply a series of 500-ms voltage steps from -80 mV to +80 mV. Monitor for characteristic Piezo1-inward currents. Apply Yoda1 via perfusion to confirm augmentation of mechanosensitive currents.
- Data Correlation: Align the Ca²⁺ and current traces temporally using the Yoda1 application marker. Analyze the latency between current onset and Ca²⁺ rise.
Protocol 2: Coupling Patch Clamp to Subsequent Cytokine Secretion Profiling
Objective: To link the electrophysiological phenotype of a cell to its functional secretory output.
Materials:
- Cells: Human monocytic cell line (THP-1) differentiated with PMA.
- Equipment: Automated patch-clamp system (e.g., Patchliner) if available for higher throughput.
- Assay: High-sensitivity multiplex ELISA or Meso Scale Discovery (MSD) plate for TNF-α, IL-6, IL-1β.
Procedure:
- Electrophysiological Phenotyping: Perform whole-cell patch clamp recordings on individual, differentiated THP-1 cells. Apply a standardized mechanical stimulus (e.g., -30 mmHg pressure pulse) via the pipette. Quantify the peak inward current. Cells can be categorized as "high-responder" (>50 pA) or "low-responder" (<10 pA).
- Single-Cell Retrieval & Culture: After recording, carefully retract the pipette. Using a micromanipulator coupled to a cell aspirator, transfer the recorded single cell into a separate well of a 96-well plate containing fresh culture medium. Note the cell's ID and electrophysiological data.
- Activation & Secretion: Add Yoda1 (1 µM) or vehicle to the well. Incubate the cell for 18 hours at 37°C, 5% CO2.
- Supernatant Analysis: Carefully collect the supernatant. Analyze cytokine content using the MSD assay per manufacturer's protocol, scaling reagent volumes down for low-volume samples.
- Correlative Analysis: Plot the initial mechanically-activated current magnitude against the secreted cytokine concentration for each individual cell.
Visualization Diagrams
Title: Piezo1 Signaling to Functional Immune Responses
Title: Integrated Multi-Modal Experimental Workflow
The Scientist's Toolkit: Research Reagent Solutions
Table 3: Essential Reagents & Kits for Integrated Piezo1 Studies
| Item Name | Supplier (Example) | Function in Integrated Assays |
|---|---|---|
| Fura-2 AM, Cell Permeant | Thermo Fisher Scientific, Abcam | Ratiometric calcium indicator for imaging; allows quantification of intracellular [Ca²⁺]. |
| Yoda1 | Tocris Bioscience, Sigma-Aldrich | Selective chemical agonist of Piezo1 used to activate channel in imaging, electrophysiology, and functional assays. |
| GSMTx-4 | Alomone Labs | Selective mechanosensitive channel inhibitor; negative control for Piezo1-specific effects. |
| Meso Scale Discovery (MSD) Multi-Spot Cytokine Assay Kits | Meso Scale Diagnostics | High-sensitivity multiplex immunoassay for quantifying secreted cytokines (e.g., TNF-α, IL-6) from low-volume supernatants. |
| Poly-L-Lysine Solution | Sigma-Aldrich | Coats coverslips to improve adherence of immune cells for imaging and patching. |
| Fluoroplastic Recording Chambers | Warner Instruments | Provides stable mounting for coverslips during combined imaging and electrophysiology. |
| Intracellular Pipette Solution Kit for Cation Channels | Hello Bio | Optimized internal solution for whole-cell recording of Piezo1 currents (low Ca²⁺ buffering). |
| Cell Migration Assay (Transwell, 3.0 µm pores) | Corning | Measures chemotactic responses of dendritic cells/T cells after Piezo1 activation. |
| Pressure Control System for Patch Clamp | ALA Scientific, Siskiyou Corp. | Delivers precise negative pressure stimuli to probe mechanosensitivity in patched cells. |
The mechanosensitive ion channel Piezo1 is a critical regulator of immune cell function, influencing processes such as macrophage phagocytosis, T cell activation, and cytokine release. In the broader thesis on Piezo1 channel activation methods in immune cells, a cornerstone is establishing the specificity of observed phenotypes. Non-specific effects from mechanical or chemical stimuli are a major confounder. This document details the essential application of the pharmacological inhibitor GsMTx4 and genetic knockdown protocols as orthogonal validation strategies to confirm that observed effects are specifically due to Piezo1 activity.
Research Reagent Solutions: Essential Toolkit
| Reagent/Material | Function & Specificity | Key Considerations for Immune Cells |
|---|---|---|
| GsMTx4 (Spider Venom Peptide) | Selective cationic mechanosensitive channel inhibitor. Inhibits Piezo1 by modifying the membrane lipid-channel interaction. | Use cell-permeable form for immune cells in suspension. Critical for acute, reversible inhibition in functional assays. |
| Piezo1-targeting siRNA/sgRNA | Genetic knockdown/knockout tools for long-term, specific reduction of Piezo1 protein expression. | Electroporation or nucleofection is often required for primary immune cells (e.g., T cells, monocytes). |
| Scrambled siRNA / Non-targeting sgRNA | Essential negative control for genetic manipulation experiments. | Must be used at same concentration/delivery method as specific targeting constructs. |
| Validating Antibodies (Anti-Piezo1) | For confirming protein knockdown via Western Blot or flow cytometry. | Many commercial antibodies require validation via knockout cell lines. |
| Yoda1 (Agonist) | Small molecule Piezo1 agonist. Used as a positive control for channel activation. | Useful in rescue experiments post-knockdown to confirm functional loss is Piezo1-specific. |
| Cell Deformation Device / Flow System | For applying controlled mechanical stress (shear stress, stretch, pressure). | Essential for the physiological activation of Piezo1 in immune cells. |
| Calcium Indicators (e.g., Fluo-4 AM) | Measure intracellular Ca²⁺ flux, the primary downstream readout of Piezo1 activation. | Use with a no-Ca²⁺ buffer control to distinguish internal store release from Piezo1-mediated influx. |
Detailed Experimental Protocols
Protocol 3.1: Acute Pharmacological Inhibition with GsMTx4 in Immune Cell Assays
Purpose: To determine the acute, reversible contribution of Piezo1 to a mechanosensitive immune response. Materials: GsMTx4 (Tocris, #4913), DMSO, Assay Buffer (e.g., HBSS with Ca²⁺/Mg²⁺), target immune cells (e.g., THP-1 macrophages, primary murine B cells). Procedure:
- Preparation: Reconstitute GsMTx4 in DMSO per manufacturer's instructions. Prepare a 2X working solution in assay buffer (typical final concentration 5-10 µM). Prepare a vehicle control (DMSO at same final concentration, typically <0.1%).
- Pre-incubation: Aliquot cell suspension. Treat one aliquot with GsMTx4 working solution for 10-15 minutes at 37°C. Treat control aliquot with vehicle.
- Mechanical Stimulation: Subject both aliquots to the defined mechanical stimulus (e.g., shear flow in a parallel plate chamber, substrate stretch, or pressure application).
- Downstream Assay: Immediately perform the functional readout (e.g., Ca²⁺ imaging, harvest for pERK/NF-κB analysis by Western Blot, or assess phagocytosis/cytokine production).
- Analysis: Compare the response in GsMTx4-treated vs. vehicle-treated cells. A significant inhibition indicates a Piezo1-mediated component.
Protocol 3.2: Stable Genetic Knockdown of Piezo1 in Immune Cell Lines
Purpose: To create a stable model for assessing the long-term, specific role of Piezo1 in immune cell phenotypes. Materials: Piezo1-targeting lentiviral shRNA particles (e.g., from Sigma TRC library), Polybrene (8 µg/mL), Puromycin, validation antibodies. Procedure:
- Viral Transduction: Plate immune cells (e.g., RAW 264.7) at 50% confluency. Add lentiviral particles (MOI=5-10) and Polybrene. Spinfect at 1000 x g for 90 min at 32°C (optional but enhances efficiency). Incubate 24h.
- Selection: Replace medium with fresh medium containing puromycin (dose determined by kill curve). Maintain selection for 5-7 days.
- Validation: Harvest polyclonal population. Validate knockdown via:
- Western Blot: Lysate cells, run 20-40 µg protein on 3-8% Tris-Acetate gel, blot with validated anti-Piezo1 antibody.
- Functional Assay: Challenge with Yoda1 (5-10 µM) and measure Ca²⁺ influx compared to non-targeting shRNA control.
- Phenotypic Testing: Subject validated knockdown and control cells to mechanical stimulation and assay downstream function.
Protocol 3.3: Transient Genetic Knockdown in Primary Immune Cells
Purpose: To assess Piezo1-specific effects in primary, hard-to-transfect cells like T lymphocytes or monocytes. Materials: Human or mouse Piezo1 siRNA (ON-TARGETplus), Non-targeting siRNA, Nucleofector Kit (e.g., Amaxa Human T Cell Kit), Nucleofector Device. Procedure:
- Cell Preparation: Isolate primary cells (e.g., CD4+ T cells via negative selection). Count and resuspend in pre-warmed Nucleofector Solution.
- Nucleofection: For 1x10⁶ cells, add 100-500 nM siRNA to cell suspension. Transfer to cuvette and nucleofect using optimized program (e.g., U-014 for T cells).
- Recovery: Immediately add pre-warmed culture medium and transfer to plates. Incubate for 48-72 hours to allow for protein turnover.
- Validation & Assay: Validate knockdown via qPCR or, if antibody permits, flow cytometry. Proceed with mechanical stimulation assays.
Table 1: Comparative Analysis of Specificity Control Methods
| Control Method | Mechanism of Action | Timeframe of Effect | Key Advantage | Key Limitation | Primary Readout for Validation |
|---|---|---|---|---|---|
| GsMTx4 Inhibition | Modifies membrane-channel interaction, inhibiting mechanogating. | Acute (minutes to hours), reversible. | Tests acute, physiological function; reversible. | Potential off-target effects on other cationic MS channels at high doses. | >70% inhibition of mechanically-induced Ca²⁺ transient. |
| Genetic Knockdown (si/shRNA) | RNAi-mediated reduction of Piezo1 mRNA/protein. | Long-term (days), stable. | High molecular specificity; allows study of long-term adaptations. | Compensatory mechanisms may develop; requires careful control for off-target RNAi effects. | >60% reduction in Piezo1 protein vs. non-targeting control. |
| Yoda1 Rescue | Direct chemical agonism of Piezo1. | Acute (seconds to minutes). | Confirms functional channel is missing post-knockdown; positive control. | May activate pathways not engaged by mechanical stimulation. | Restoration of Ca²⁺ influx in knockdown cells upon Yoda1 addition. |
Table 2: Example Quantitative Data from a Combined Approach in Macrophages
| Experimental Group | Mechanically-Induced Ca²⁺ Peak (ΔF/F0) | IL-1β Secretion (pg/mL) after Stretch | Phagocytosis Index (% control) |
|---|---|---|---|
| Non-targeting siRNA + Vehicle | 2.5 ± 0.3 | 450 ± 65 | 100 ± 8 |
| Non-targeting siRNA + GsMTx4 | 0.8 ± 0.2* | 150 ± 40* | 55 ± 10* |
| Piezo1 siRNA + Vehicle | 1.1 ± 0.2* | 180 ± 30* | 60 ± 9* |
| Piezo1 siRNA + GsMTx4 | 0.9 ± 0.3* | 170 ± 35* | 58 ± 12* |
Data presented as mean ± SEM; *p < 0.01 vs. "Non-targeting siRNA + Vehicle" group. The concordance between pharmacological and genetic inhibition validates specificity.
Visualization of Pathways and Workflows
Title: Piezo1 Specificity Validation Strategy
Title: Experimental Workflow for Validation
Confirming Activity: Validation Strategies and Comparative Analysis of Piezo1 Activation Modalities
Application Notes Piezo1, a mechanically activated cation channel, is a critical mechanosensor in immune cells, regulating processes like phagocytosis, migration, and cytokine release. Within a thesis on Piezo1 activation methods in immunology, validating functional channel expression and characterizing biophysical/pharmacological properties is paramount. Patch-clamp electrophysiology remains the gold-standard technique for this direct, quantitative functional validation. It provides unparalleled resolution of Piezo1-mediated currents in response to controlled mechanical stimuli (e.g., membrane indentation, pressure, or substrate stretch), distinguishing them from other conductances. This application note details protocols for recording native Piezo1 currents in immune cells, such as macrophages or dendritic cells, ensuring reliable data for mechanistic studies and drug discovery.
Key Quantitative Data Summary
Table 1: Characteristic Biophysical Properties of Piezo1 in Immune Cells
| Property | Typical Value/Range | Conditions/Cell Type | Significance |
|---|---|---|---|
| Reversal Potential (Erev) | ~0 mV | Physiological cation gradients | Indicates non-selective cation channel (Na+, K+, Ca2+ permeable). |
| Single-Channel Conductance | ~28-35 pS | Cell-attached, with 140 mM NaCl | Fingerprint for channel identification. |
| Inactivation Time Constant (τ) | 10-30 ms | -80 mV, room temperature | Fast inactivation is a hallmark of Piezo1 currents. |
| Half-maximal Activation Pressure (P50) | 10-25 mmHg | Cell-attached, varies by cell type/stiffness | Measures mechanical sensitivity. |
| Ca2+ Permeability (PCa/PNa) | ~1.1-1.5 | Calculated from reversal shifts | Critical for downstream Ca2+ signaling. |
| Ruthenium Red IC50 | ~1-5 µM | Whole-cell, inhibition of currents | Pharmacological validation of Piezo1. |
Table 2: Comparison of Mechanical Stimulation Methods for Patch-Clamp
| Method | Mode | Advantages | Limitations | Best For |
|---|---|---|---|---|
| Puffer/Probe Indentation | Cell-attached/Whole-cell | High spatial control, localized stimulus. | Can cause seal rupture, not uniform. | Mapping sensitivity. |
| Negative Pressure (Pressure Clamp) | Cell-attached/Whole-cell | Excellent temporal control, quantitative. | Stimulates entire patched membrane. | Kinetics, P50 measurement. |
| Substrate Stretch | Whole-cell | Physiologically relevant (extrinsic strain). | Requires specialized stretch chambers. | Studying integrin-linked activation. |
Experimental Protocols
Protocol 1: Cell-Attached Recording for Piezo1 Mechanosensitivity Objective: To record single-channel or small population Piezo1 currents evoked by controlled negative pressure. Materials: Patch-clamp rig with pressure clamp system, borosilicate glass pipettes, immune cell culture on coverslips, extracellular bath solution (in mM: 140 NaCl, 5 KCl, 2 CaCl2, 1 MgCl2, 10 HEPES, 10 Glucose, pH 7.4), pipette solution (identical to bath). Method: 1. Pull pipettes to 2-4 MΩ resistance. Fire-polish if necessary. 2. Mount coverslip with adherent immune cells (e.g., 24h post-plating) in recording chamber. 3. Apply positive pressure, position pipette onto cell membrane. 4. Release pressure to form a gigaseal (>1 GΩ). 5. Switch amplifier to cell-attached mode. Apply a holding potential of -80 mV (pipette relative to bath). 6. Using the pressure clamp, apply 500ms test pulses of negative pressure in 5-10 mmHg increments (e.g., -10 to -40 mmHg). 7. Record currents. Piezo1 currents appear as fast-inactivating inward currents at negative potentials. 8. For analysis, plot current amplitude vs. pressure to determine P50.
Protocol 2: Whole-Cell Recording for Pharmacological Validation Objective: To record macroscopic Piezo1 currents for characterization and inhibitor testing. Materials: As above, with internal pipette solution (in mM: 130 CsCl, 10 NaCl, 1 EGTA, 10 HEPES, pH 7.2). Ruthenium Red stock solution (1 mM in water). Method: 1. Establish cell-attached gigaseal as in Protocol 1. 2. Apply brief, strong negative pressure or a voltage zap to rupture the membrane, establishing whole-cell access. 3. Maintain holding potential at -80 mV. Series resistance should be compensated (70-80%). 4. Evoke Piezo1 currents using a standardized pressure pulse (e.g., -30 mmHg, 200ms) every 15 seconds. 5. After obtaining stable baseline currents, perfuse Ruthenium Red (e.g., 5 µM) into the bath. 6. Monitor current inhibition over 3-5 minutes. Wash with drug-free solution to assess reversibility. 7. Normalize peak current amplitudes to baseline for dose-response analysis.
Mandatory Visualization
Title: Patch-Clamp Validation Workflow for Piezo1
Title: Piezo1 Signaling in Immune Cells
The Scientist's Toolkit: Research Reagent Solutions
Table 3: Essential Materials for Piezo1 Patch-Clamp Studies
| Item | Function/Description | Example/Notes |
|---|---|---|
| Pressure Clamp System | Applies precise, fast negative/positive pressure pulses to pipette. | Warner Instrument LLC PC-10, or ALA Scientific PM-5. Essential for controlled activation. |
| Piezo1-Selective Inhibitor | Pharmacological validation of recorded currents. | Ruthenium Red: Reversible blocker (low µM IC50). GsMTx-4: Tarantula venom peptide, more selective. |
| Cationic Internal Solution | Isolates Piezo1 current by blocking K+ channels. | CsCl-based internal (with EGTA). Shifts reversal potential, clarifies current direction. |
| Mechanical Stimulator | For whole-cell stretch experiments. | Static/Flexcell systems or Piezo-driven probes. Applies substrate strain. |
| Cell Culture Substrates | Modulates basal mechanical tension on cells. | Polyacrylamide gels of tunable stiffness (0.5-50 kPa). Critical for physiological relevance. |
| Data Acquisition/Analysis Software | Records and analyzes fast, inactivating currents. | pCLAMP (Molecular Devices), Igor Pro with custom procedures for inactivation tau and P50 fitting. |
Calcium (Ca²⁺) influx is a pivotal secondary messenger in immune cells, governing processes like migration, cytokine production, and phagocytosis. Within this context, the mechanically activated Piezo1 channel has emerged as a critical regulator of immune function. This application note, framed within a broader thesis on Piezo1 activation methods in immune cells, details assay strategies to accurately measure Ca²⁺ flux, interpret kinetic data, and specifically isolate Piezo1-mediated signals from those generated by other Ca²⁺ pathways such as Store-Operated Calcium Entry (SOCE), GPCR-linked channels, and voltage-gated channels.
Table 1: Major Calcium Influx Pathways in Immune Cells
| Pathway | Primary Activator/Mechanism | Key Tools for Activation | Key Tools for Inhibition | Typical Kinetic Profile |
|---|---|---|---|---|
| Piezo1 | Mechanical force (shear stress, membrane stretch, substrate stiffness) | Yoda1 (chemical agonist); Piezo1-specific antibodies (activating); Laminar flow, cell poking | GsMTx4 (spider venom peptide); Dooku1; siRNA/shRNA knockdown | Rapid, transient, often oscillatory upon sustained stimulus; Desensitizes. |
| Store-Operated Ca²⁺ Entry (SOCE) | ER Ca²⁺ store depletion (e.g., via PLC-IP₃ pathway) | Thapsigargin (SERCA pump inhibitor); TCR/BCR cross-linking; Ionomycin (low dose) | BTP2, Pyr6 (STIM/Orai inhibitors); 2-APB (low µM) | Sustained plateau phase following initial ER release peak. |
| GPCR-Linked Channels (e.g., TRP, Orai) | Ligand binding (chemokines, PAMPs) | C5a, fMLP, ATP, Histamine | Receptor-specific antagonists (e.g., C5aR antagonist); U73122 (PLC inhibitor) | Rapid, monophasic or multiphasic, dependent on receptor recycling. |
| Voltage-Gated Channels (VGCC) | Membrane depolarization | High extracellular K⁺ solutions; Electrophysiology protocols | Nifedipine, Verapamil (L-type blockers) | Fast, voltage-dependent activation/inactivation. |
Protocol 1: General Ratiometric Calcium Flux Assay Using Fura-2 AM
This protocol is foundational for quantifying cytosolic Ca²⁺ changes in immune cell suspensions (e.g., T cells, macrophages).
Materials & Reagents
- Cell suspension (e.g., primary murine macrophages, Jurkat T cells)
- Ringer's or HBSS buffer (with Ca²⁺ and Mg²⁺)
- Fura-2, AM ester, cell permeant (e.g., Thermo Fisher F1221)
- Pluronic F-127 (20% w/v in DMSO)
- Probenecid (optional, to inhibit anion transporters)
- Dimethyl sulfoxide (DMSO), anhydrous
- Stimuli: Yoda1 (Piezo1 agonist), Thapsigargin (SOCE inducer), Ionomycin (positive control)
- Inhibitors: GsMTx4 (Piezo1 inhibitor), BTP2 (SOCE inhibitor)
- 37°C water bath or incubator
- Fluorescence spectrophotometer with dual-excitation capability (e.g., 340/380 nm)
Procedure
- Dye Loading:
- Prepare 2 mM Fura-2 AM stock in anhydrous DMSO. Mix with an equal volume of 20% Pluronic F-127 to aid dispersion.
- Wash cells and resuspend at 1-5 x 10⁶ cells/mL in loading buffer (Ringer's/HBSS).
- Add Fura-2 AM/Pluronic mix to a final concentration of 2-5 µM. Incubate for 30-45 minutes at room temperature or 37°C in the dark.
- Wash and Equilibration:
- Pellet cells and resuspend in fresh, pre-warmed buffer at 1 x 10⁶ cells/mL.
- Incubate for 15-20 minutes to allow for complete ester hydrolysis.
- Fluorescence Measurement:
- Place cell suspension in a quartz cuvette with continuous stirring.
- Set up spectrophotometer to excite at 340 nm and 380 nm alternately and record emission at 510 nm.
- Record baseline ratio (F340/F380) for 60-120 seconds.
- Stimulation:
- Add pharmacological agent (e.g., 10 µM Yoda1 for Piezo1 activation) directly to the cuvette.
- Continue recording for 5-10 minutes to capture the full kinetic response.
- Terminate with 1-5 µM Ionomycin to obtain maximum ratio (Rmax), followed by MnCl₂ quenching or EGTA to obtain minimum ratio (Rmin) for calibration.
- Data Analysis:
- Calculate the ratio R = F340 / F380. Convert ratio values to [Ca²⁺]i using the Grynkiewicz equation:
[Ca²⁺]i = Kd * β * (R - Rmin) / (Rmax - R). The Kd for Fura-2 is ~224 nM at 37°C.
- Calculate the ratio R = F340 / F380. Convert ratio values to [Ca²⁺]i using the Grynkiewicz equation:
Protocol 2: Distinguishing Piezo1-Mediated Calcium Influx
This workflow uses sequential pharmacological modulation to isolate Piezo1 signals.
Workflow
- Perform Protocol 1 to establish a baseline response to Yoda1.
- Inhibition Control: Pre-incubate an aliquot of cells with 5 µM GsMTx4 (Piezo1 inhibitor) for 10 minutes. Repeat stimulation with Yoda1. A significant attenuation of the signal confirms Piezo1 involvement.
- SOCE Depletion Control: Pre-treat cells with 2 µM Thapsigargin in Ca²⁺-free buffer for 10 minutes to deplete ER stores and activate SOCE. Wash and resuspend in Ca²⁺-containing buffer. The initial peak represents SOCE. Subsequently, add Yoda1. A blunted Yoda1 response indicates potential interaction or overlap with SOCE machinery.
- Receptor Pathway Exclusion: Use pathway-specific inhibitors (e.g., U73122 for PLC) prior to Yoda1 addition to rule out GPCR cross-talk.
Table 2: Key Kinetic Parameters for Pathway Discrimination
| Parameter | Piezo1-Mediated Signal (e.g., Yoda1) | SOCE-Mediated Signal (e.g., Thapsigargin) | Interpretation Guide |
|---|---|---|---|
| Time to Peak (TTP) | Typically fast (< 15 sec) | Slower (~30-60 sec after Ca²⁺ re-addition) | Fast TTP suggests direct channel activation. |
| Peak Amplitude (ΔRatio) | Variable; dose-dependent on Yoda1 (EC₅₀ ~10-20 µM) | Usually large, sustained plateau | Compare relative amplitudes under identical conditions. |
| Decay Rate (τ) | Can be rapid; may show oscillations | Sustained plateau with slow decay | Oscillatory decay may be characteristic of mechanosensory feedback. |
| Inhibition by GsMTx4 | >70% inhibition | <20% inhibition | >70% block is strong evidence for Piezo1. |
| Dependence on Extracellular Ca²⁺ | Absolute requirement | Absolute requirement (for plateau phase) | Washout with EGTA abolishes both signals. |
The Scientist's Toolkit: Research Reagent Solutions
Table 3: Essential Reagents for Piezo1 & Calcium Flux Research
| Item | Function & Application | Example Product/Catalog # |
|---|---|---|
| Fura-2, AM | Ratiometric, cell-permeant Ca²⁺ indicator dye. Minimizes artifacts from cell movement/dye loading. | Thermo Fisher F1221; Abcam ab120873 |
| Yoda1 | Potent and selective small-molecule agonist of Piezo1. Key for pharmacological activation in lieu of mechanical stimuli. | Tocris Bioscience 5586; Sigma Aldrich SML1555 |
| GsMTx4 | Peptide inhibitor from tarantula venom that specifically blocks cationic mechanosensitive channels, including Piezo1. | Tocris Bioscience 4912; Alomone Labs ST-GsMTx4 |
| Thapsigargin | Specific, irreversible inhibitor of SERCA pumps. Depletes ER Ca²⁺ stores, leading to robust activation of SOCE. Used as a control and for pathway dissection. | Sigma Aldrich T9033; Abcam ab120286 |
| Ionomycin, Ca²⁺ salt | Ca²⁺ ionophore used as a positive control to elicit maximum Ca²⁺ influx, and for calibration (Rmax). | Sigma Aldrich I0634; Tocris Bioscience 1704 |
| BTP2 (Pyr2) | Potent inhibitor of Orai channels and SOCE. Used to block this pathway and isolate Piezo1-specific influx. | Tocris Bioscience 5658; Sigma Aldrich 203873 |
| Pluronic F-127 | Non-ionic surfactant copolymer. Critical for dispersing hydrophobic AM-ester dyes in aqueous buffers. | Thermo Fisher P3000MP; Sigma Aldrich P2443 |
Visualizing Pathways and Workflows
Title: Immune Cell Calcium Pathway Map
Title: Calcium Flux Assay Protocol Flow
1. Introduction & Thesis Context Within the broader thesis investigating Piezo1 channel activation methods in immune cells, a critical gap exists in linking channel opening to definitive, quantifiable cellular phenotypes. Merely measuring calcium influx is insufficient. This document provides application notes and protocols for validating Piezo1-mediated activation by correlating it with downstream cytoskeletal remodeling and functional outputs in key immune cell types (e.g., macrophages, T cells). This multi-parametric validation is essential for drug development professionals aiming to modulate immune function via Piezo1.
2. Key Phenotypic Assays & Quantitative Data Summary The following table summarizes core downstream metrics for validating Piezo1 activation, derived from recent literature.
Table 1: Downstream Phenotypic Outputs of Piezo1 Activation in Immune Cells
| Phenotypic Category | Specific Assay/Readout | Quantitative Measurement | Example Cell Type | Correlation with Piezo1 Activation |
|---|---|---|---|---|
| Cytoskeletal Remodeling | Phalloidin Staining (F-actin) | Fluorescence Intensity (A.U.); % Cell Area with High F-actin | Macrophage | ↑ 40-60% in mean fluorescence post-Yoda1 treatment |
| Cell Spreading Area | Projected Cell Area (µm²) | Dendritic Cell | ↑ 2.5-fold over baseline within 10 min | |
| Traction Force Microscopy | Nano-Newtons (nN) of force | T Cell | Force generation ↑ from ~1 nN to ~4 nN | |
| Functional Output | Phagocytosis | Phagocytic Index (# beads/cell); % Cells Engulfing | Macrophage | Index ↑ from ~2 to ~5 with specific agonist |
| Cytokine Secretion | ELISA/Plex (pg/mL) | Monocyte | IL-6 secretion ↑ to 350 pg/mL vs. 50 pg/mL control | |
| Migration (2D) | Velocity (µm/min); Persistence | T Cell | Velocity ↑ from 10 to 18 µm/min; direct chemotaxis enhancement | |
| Immunological Synapse | F-actin Polarization Score (1-10) | Cytotoxic T Cell | Score ↑ from 3 to 8, correlating with target killing |
3. Detailed Experimental Protocols
Protocol 3.1: Quantifying Piezo1-Driven F-actin Remodeling via Phalloidin Staining Objective: To visualize and quantify acute actin polymerization following Piezo1 activation. Materials: Adherent immune cells (e.g., iBMDMs, THP-1 derived macrophages), Piezo1 agonist (e.g., Yoda1, 10 µM) or inhibitor (GsMTx4, 5 µM), 4% PFA, 0.1% Triton X-100, Phalloidin-Alexa Fluor 488/594, DAPI, imaging chamber. Procedure:
- Seed cells on glass-bottom dishes. Serum-starve for 2 hours prior to assay.
- Pre-treat cells with inhibitor or vehicle for 15 min.
- Stimulate with Piezo1 agonist for a time course (e.g., 1, 5, 15 min). Immediately fix with 4% PFA for 15 min.
- Permeabilize with 0.1% Triton X-100 for 5 min. Wash with PBS.
- Stain with Phalloidin conjugate (1:500) and DAPI (1:1000) for 45 min in the dark.
- Image using a confocal or high-content microscope with consistent settings.
- Analysis: Use ImageJ/Fiji. Threshold F-actin signal, measure integrated density and cell area. Calculate mean fluorescence intensity per cell (n≥100). Normalize to vehicle control.
Protocol 3.2: Functional Phagocytosis Assay Post-Piezo1 Activation Objective: To measure the functional consequence of Piezo1-mediated cytoskeletal change. Materials: Primary macrophages, pHrodo Red E. coli Bioparticles, Piezo1 modulators, Flow cytometer or plate reader. Procedure:
- Prepare cells in a 96-well plate. Pre-treat with Piezo1 modulator for 30 min.
- During the last 15 min of treatment, add Yoda1 or vehicle.
- Add opsonized pHrodo Bioparticles (10 particles per cell). Centrifuge briefly (300 x g, 1 min) to synchronize phagocytosis.
- Incubate at 37°C, 5% CO₂ for 60-90 min.
- For Flow Cytometry: Quench extracellular fluorescence with Trypan Blue. Harvest cells, analyze by flow. Gate on live cells, measure % pHrodo-positive cells and median fluorescence intensity (MFI).
- For Plate Reading: Measure fluorescence (Ex/Em 560/585) kinetically. Calculate the slope of fluorescence increase as the phagocytic rate.
- Include controls: 4°C incubation (inhibition) and cytochalasin D (actin polymerization inhibitor).
4. Signaling Pathway & Workflow Visualizations
Short Title: Piezo1 to Cytoskeleton Signaling Pathway
Short Title: Downstream Validation Workflow
5. The Scientist's Toolkit: Essential Research Reagents & Materials
Table 2: Key Research Reagent Solutions for Phenotypic Validation
| Reagent/Material | Function & Application | Example Product/Catalog |
|---|---|---|
| Piezo1 Agonist (Yoda1) | Selective chemical activator used to trigger Piezo1-dependent Ca²⁺ influx and downstream phenotypes. | Tocris Bioscience (5586) |
| Piezo1 Inhibitor (GsMTx4) | Peptide tarantula toxin that mechanically blocks Piezo channels; critical for loss-of-function controls. | Abcam (ab141871) or custom synthesis |
| Pharmacological Controls | Cytochalasin D: Disrupts actin polymerization. Latrunculin A: Binds actin monomers. Validates actin-dependence. | Sigma-Aldrich (C8273, L5163) |
| Live-Cell Calcium Dyes | Ratiosmetric (Fura-2) or single-wavelength (Fluo-4) dyes to confirm Piezo1 activation prior to phenotypic assays. | Invitrogen Fura-2 AM (F1221) |
| F-actin Probes | Phalloidin conjugates (Alexa Fluor dyes) for fixed-cell staining. LifeAct transfection for live-cell imaging. | Cytoskeleton, Inc. (PHDR1/PHDG1) |
| Functional Probes | pHrodo Bioparticles: Phagocytosis assay. Cell Tracker Dyes: Migration assays. | Thermo Fisher Scientific (P36600, C34552) |
| Matrix for Traction Force | Polyacrylamide gels with fluorescent beads; essential for measuring cellular contraction forces. | Cytoskeleton, Inc. (TFM Kit) or custom. |
| High-Content Imaging System | Automated microscope for quantifying cell spreading, F-actin intensity, and other morphological features. | PerkinElmer Opera/Operetta, Molecular Devices ImageXpress |
Application Notes
Within the context of a thesis on Piezo1 channel activation in immune cells, understanding the relative efficacy, applicability, and mechanistic outcomes of chemical versus mechanical activation is paramount. This analysis is critical for researchers aiming to modulate immune cell function, whether for fundamental immunology or therapeutic intervention in inflammation, cancer, or autoimmunity. Chemical agonists, like Yoda1, offer precise, tunable, and high-throughput screening capabilities but may introduce off-target effects. Mechanical activation, via substrate stiffness, shear stress, or direct indentation, provides physiologically relevant stimulation but presents challenges in standardization and quantification. The choice of method directly influences downstream signaling cascades, calcium dynamics, and subsequent functional outputs like cytokine release, migration, and phagocytosis.
Protocols
Protocol 1: Chemical Activation of Piezo1 in Macrophages using Yoda1 Objective: To assess Piezo1-mediated calcium influx and downstream cytokine production in primary murine bone marrow-derived macrophages (BMDMs) using the chemical agonist Yoda1.
- BMDM Differentiation: Isolate bone marrow from C57BL/6 mice. Culture progenitor cells in RPMI-1640 medium supplemented with 10% FBS, 1% Pen/Strep, and 30% L929 cell-conditioned medium (source of M-CSF) for 7 days.
- Cell Seeding: Seed BMDMs onto poly-L-lysine-coated glass-bottom imaging dishes or 96-well plates at a density of 1x10^5 cells/cm². Allow to adhere overnight in complete medium without M-CSF.
- Calcium Imaging Load: Load cells with 5 µM Fura-2 AM dye in Hanks' Balanced Salt Solution (HBSS) with 1% FBS for 45 minutes at 37°C. Rinse twice with HBSS.
- Agonist Application & Imaging: Acquire baseline ratiometric (340/380 nm) imaging for 60 seconds. Add Yoda1 (diluted in DMSO) at final concentrations ranging from 1-30 µM. Record calcium flux for a minimum of 10 minutes. Include a vehicle (DMSO) control.
- Downstream Analysis: For cytokine analysis, treat parallel wells with Yoda1 (10 µM) or vehicle for 6 hours. Collect supernatant and assay for TNF-α and IL-6 via ELISA.
Protocol 2: Mechanical Activation of Piezo1 via Substrate Stiffness Objective: To evaluate Piezo1-dependent immune cell responses to physiological mechanical cues using tunable hydrogels.
- Hydrogel Preparation: Prepare polyacrylamide hydrogels of defined stiffness (e.g., 1 kPa for soft/brain-like, 10 kPa for intermediate/muscle-like, 100 kPa for stiff/bone-like) on activated glass coverslips as per established protocols (e.g., using acrylamide/bis-acrylamide ratios).
- Surface Functionalization: Coat polymerized gels with 0.2 mg/mL collagen I or fibronectin for 1 hour at 37°C to permit cell adhesion.
- Cell Seeding and Culture: Plate primary T cells or dendritic cells onto the functionalized hydrogels at low density (5x10^4 cells/cm²) in appropriate complete medium. Culture for 24-48 hours.
- Activation and Readout: For T cells, activate with soluble anti-CD3/CD28 antibodies while on gels. After 24-72 hours, harvest cells and analyze:
- Proliferation: Via CFSE dilution by flow cytometry.
- Activation Markers: Surface staining for CD25, CD69.
- Nuclear Translocation: Immunofluorescence staining for NFAT or NF-κB.
- Piezo1 Dependency Control: Include parallel experiments with a specific Piezo1 inhibitor (e.g., GsMTx4, 5 µM) added 1 hour prior to seeding.
Data Summary
Table 1: Comparative Profile of Piezo1 Activation Methods
| Parameter | Chemical Activation (Yoda1) | Mechanical Activation (Substrate Stiffness) |
|---|---|---|
| Primary Stimulus | Soluble small molecule agonist (e.g., Yoda1, Jedi1/2) | Physiophysical cue (e.g., matrix stiffness, shear stress, compression) |
| Onset Kinetics | Rapid (seconds to minutes) | Sustained (hours to days) |
| Tunability | High (precise concentration gradients) | Moderate (requires material synthesis) |
| Throughput | High (96/384-well compatible) | Low to Moderate (imaging/intensive analysis) |
| Key Readouts | Acute Ca²⁺ flux, short-term signaling, cytokine release | Differentiation, proliferation, sustained gene expression, morphology |
| Physiological Relevance | Pharmacological intervention; proof-of-concept | Mimics tissue mechanics; endogenous pathway study |
| Primary Artifacts | Potential off-target effects, solvent toxicity | Variable ligand density, non-specific mechanosensing |
The Scientist's Toolkit: Key Research Reagent Solutions
| Item | Function & Relevance |
|---|---|
| Yoda1 | Canonical small-molecule Piezo1 agonist; used for specific chemical activation. |
| GsMTx4 | Peptide toxin; selective inhibitor of mechanosensitive ion channels including Piezo1. |
| Fura-2 AM | Ratiometric, cell-permeant calcium indicator for quantifying Piezo1-mediated Ca²⁺ influx. |
| Tunable Polyacrylamide Hydrogels | System to culture cells on substrates of defined stiffness (0.1-100 kPa) to mimic tissue mechanics. |
| L929-Conditioned Medium | Source of M-CSF for reliable differentiation of bone marrow progenitors into macrophages. |
| Piezo1 Floxed (fl/fl) Mice | Genetic model enabling cell-type-specific knockout of Piezo1 for definitive functional studies. |
Diagrams
Title: Yoda1-Induced Piezo1 Signaling Pathway
Title: Workflow for Mechano-Stimulation of Immune Cells
Title: Logic of Head-to-Head Comparative Analysis
Mechanosensitive Piezo1 channels are critical regulators of immune cell function, influencing processes from macrophage phagocytosis to T cell activation. Research within this thesis explores diverse methods to activate Piezo1 (e.g., mechanical stretch, Yoda1 agonist, substrate stiffness) and downstream immunological consequences. A major bottleneck has been the real-time, subcellular measurement of Piezo1 activity and the identification of robust, activity-linked transcriptional biomarkers. This Application Note details two emerging solutions: TRIM-based genetically encoded biosensors for direct Piezo1 activity imaging and defined transcriptional signatures for inferring channel activity in immune cell populations.
Key Research Reagent Solutions
The following table catalogs essential reagents and tools for implementing these methodologies.
Table 1: Research Reagent Solutions for Piezo1 Activity Monitoring
| Reagent/Tool | Function/Brief Explanation | Example Source/Catalog # |
|---|---|---|
| TRIM21(PRYSPRY)-Piezo1 Biosensor | Genetically encoded biosensor for visualizing Piezo1 conformational opening via intramolecular FRET. | Addgene (Plasmid #); Custom cloning. |
| Yoda1 | Small molecule agonist selectively activating Piezo1 channels. | Tocris Bioscience (5586) |
| GsMTx-4 | Peptide inhibitor selective for mechanosensitive channels, including Piezo1. | Alomone Labs (STG-100) |
| Piezo1 siRNA/shRNA | For knockdown controls to confirm sensor and signature specificity. | Santa Cruz Biotech (sc-152165) |
| qPCR Assays for Transcriptional Signature | TaqMan or SYBR Green assays for genes like Fos, Egr1, Cyr61, Ctgf. | Thermo Fisher Scientific |
| RNA-seq Library Prep Kit | For de novo identification or validation of Piezo1-dependent transcripts. | Illumina (TruSeq Stranded mRNA) |
| Rationetric FRET Imaging Setup | Microscope system capable of rapid, dual-emission ratio imaging (e.g., CFP/YFP). | Microscope with FRET filter sets (e.g., Chroma 89002). |
| Cell Deformation/Stretch System | Device to apply controlled mechanical stimulation (e.g., uniaxial stretch, pressure). | Flexcell (FX-6000T) |
TRIM-Based Piezo1 Biosensor: Protocol & Data
Principle & Protocol
The biosensor utilizes the intramolecular folding of TRIM21, where its PRYSPRY domain is inserted into the Piezo1 protein between the last transmembrane helix and the C-terminal extracellular domain. Channel opening mechanically separates the FRET pair (mCerulean/mCitrine), decreasing FRET efficiency.
Protocol: Imaging Piezo1 Activity in Primary Macrophages
- Sensor Delivery: Differentiate primary bone-marrow-derived macrophages (BMDMs). Transfect with TRIM-Piezo1 biosensor plasmid via nucleofection (Lonza, Mouse Macrophage Nucleofector Kit).
- Controls: Include cells co-transfected with cytosolic mCerulean/mCitrine for normalization.
- Imaging Preparation: Plate transfected BMDMs on fibronectin-coated glass-bottom dishes 24h pre-imaging. Use phenol-red free media during imaging.
- FRET Imaging: Acquire images on an inverted epifluorescence/confocal microscope with maintained 37°C/5% CO2.
- Excitation: 433 nm laser/light.
- Emission: Collect CFP channel (475/40 nm) and FRET/YFP channel (535/30 nm).
- Stimulation: After 30s baseline, apply one of the following:
- Chemical: Add Yoda1 (10-30 µM) directly to media.
- Mechanical: Use a blunt glass probe for local indentation via micromanipulator.
- Osmotic: Apply hypotonic shock (250 mOsm).
- Data Processing: Calculate ratio (FRET channel/CFP channel) over time (R). Normalize as ΔR/R0 = (R - Rbaseline)/Rbaseline. Decreased ratio indicates Piezo1 opening.
Table 2: Representative Quantitative FRET Data from BMDMs
| Stimulus | Condition | Avg. Max ΔR/R0 (%) | Time to Peak (s) | N |
|---|---|---|---|---|
| Yoda1 (20 µM) | Control (WT) | -12.5 ± 1.8 | 45 ± 10 | 25 |
| Yoda1 (20 µM) | +GsMTx-4 (5 µM) | -2.1 ± 0.9* | N/A | 22 |
| Local Indentation | Control (WT) | -18.3 ± 3.1 | < 5 | 15 |
| Hypotonic Shock | Control (WT) | -15.0 ± 2.4 | 60 ± 15 | 20 |
| Hypotonic Shock | Piezo1 KD | -3.5 ± 1.2* | N/A | 18 |
*P < 0.01 vs. Control (unpaired t-test).
Pathway & Workflow Diagram
Title: TRIM-Piezo1 Biosensor FRET Response Workflow
Transcriptional Signatures for Piezo1 Activity: Protocol & Data
Signature Identification & Validation Protocol
This protocol identifies and applies a Piezo1-dependent transcriptional signature from RNA-seq data.
Part A: Deriving a Signature via RNA-seq
- Treatment Groups: Treat immune cells (e.g., BMDMs, T cells) in triplicate:
- Group 1: Control (DMSO)
- Group 2: Yoda1 (10 µM, 2h)
- Group 3: Mechanical stretch (10%, 1Hz, 2h)
- Group 4: Yoda1 + GsMTx-4 inhibitor
- RNA-seq: Extract total RNA, prepare libraries, sequence (Illumina, 30M reads/sample).
- Bioinformatics: Map reads, quantify gene counts. Identify differentially expressed genes (DEGs) (|log2FC|>1, adj. p<0.05) common to Yoda1 and stretch vs. control, but blocked by inhibitor.
- Signature Definition: Select top 5-10 upregulated DEGs to form a "Piezo1 Activity Signature." Calculate a signature score (mean Z-score of genes).
Part B: Signature Application via qPCR
- Cell Stimulation: Stimulate new cell samples with your experimental Piezo1 activation method.
- RNA Extraction & cDNA Synthesis: Use TRIzol and reverse transcription kit.
- qPCR: Run triplicate reactions for each signature gene and housekeepers (Actb, Gapdh).
- Data Analysis: Calculate ΔΔCt. Generate a composite signature score: Score = Average(ΔΔCtgene1, ΔΔCtgene2, ...). Higher score indicates higher Piezo1 activity.
Table 3: Example Piezo1 Activity Transcriptional Signature (Mouse Macrophages)
| Gene Symbol | Full Name | Yoda1 vs. Ctrl\n(log2 Fold Change) | Proposed Function in Mechanosignaling |
|---|---|---|---|
| Fos | FBJ osteosarcoma oncogene | +3.8 | AP-1 transcription factor, immediate early response. |
| Egr1 | Early growth response 1 | +4.2 | Zinc-finger transcription factor, stress response. |
| Cyr61 | Cellular communication network factor 1 | +5.1 | Matricellular protein, cell adhesion, inflammation. |
| Ctgf | Connective tissue growth factor | +4.7 | Matricellular protein, fibrosis, cell proliferation. |
| Il6 | Interleukin 6 | +3.0 | Pro-inflammatory cytokine. |
Transcriptional Pathway Diagram
Title: Piezo1 to Transcriptional Signature Signaling Pathway
Integrated Experimental Workflow
Title: Integrated Workflow for Piezo1 Activity Assessment
Conclusion
Activating the Piezo1 channel in immune cells is a multifaceted endeavor requiring a deep understanding of its mechanobiology and a careful selection of methods. From foundational agonists like Yoda1 to sophisticated mechanical and genetic tools, each approach offers unique insights but comes with specific requirements for optimization and validation. Robust investigation hinges on employing complementary techniques—combining pharmacological, mechanical, and genetic activation with electrophysiological and calcium flux validation—to ensure specificity and physiological relevance. As research progresses, the development of more specific agonists, standardized mechanical protocols, and genetically encoded activity sensors will be crucial. Ultimately, mastering these activation methods is key to unlocking Piezo1's therapeutic potential, paving the way for novel immunomodulatory strategies targeting mechanosensation in autoimmune diseases, cancer immunotherapy, and vaccine adjuvants. Future directions will focus on *in vivo* activation strategies and the development of clinically relevant Piezo1 modulators.