A Complete Guide to TIRF Microscopy for Microtubule Dynamics: From Principles to Drug Discovery Applications
This comprehensive guide details the implementation and application of Total Internal Reflection Fluorescence (TIRF) microscopy for studying microtubule dynamics in live cells.
A Complete Guide to TIRF Microscopy for Microtubule Dynamics: From Principles to Drug Discovery Applications
Abstract
This comprehensive guide details the implementation and application of Total Internal Reflection Fluorescence (TIRF) microscopy for studying microtubule dynamics in live cells. It covers the foundational principles of TIRF and its unique advantages for visualizing single microtubules. A step-by-step methodological protocol is provided, including sample preparation, imaging, and quantitative analysis of dynamic instability parameters (growth, shrinkage, catastrophe, rescue). The article addresses common troubleshooting challenges and optimization strategies for signal-to-noise ratio and photostability. Finally, it discusses validation techniques and compares TIRF with other imaging modalities, highlighting its critical role in basic cytoskeleton research and in screening and characterizing novel anti-mitotic therapeutics in drug development.
Understanding TIRF Microscopy: The Foundation for High-Resolution Microtubule Imaging
Article Context: This document serves as a detailed application note and protocol guide, framed within a broader thesis investigating microtubule dynamics and kinesin motility assays using Total Internal Reflection Fluorescence (TIRF) microscopy for drug discovery research.
Total Internal Reflection Fluorescence (TIRF) microscopy is a powerful optical technique that enables the selective excitation of fluorophores in an extremely thin optical section, typically less than 200 nm from the coverglass-buffer interface. This is achieved by exploiting the physical phenomenon of total internal reflection.
When a laser beam traveling through a high-refractive-index medium (e.g., the microscope objective and immersion oil, n₁) strikes an interface with a lower-refractive-index medium (e.g., the aqueous sample buffer, n₂) at an angle greater than the "critical angle" (θc), the beam undergoes total internal reflection. Although the incident light is entirely reflected, a standing electromagnetic wave, known as the evanescent field, is generated in the lower-index medium. This field decays exponentially with distance (z) from the interface.
Key Quantitative Parameters:
- Penetration Depth (d): The distance at which the evanescent field intensity decays to 1/e (~37%) of its value at the interface. It is calculated as: [ d = \frac{\lambda0}{4\pi} \left[ n1^2 \sin^2\theta - n_2^2 \right]^{-1/2} ] where λ₀ is the wavelength of light in a vacuum, n₁ and n₂ are the refractive indices, and θ is the incident angle.
- Critical Angle (θc): θc = arcsin(n₂/n₁)
The selective excitation provided by the evanescent field dramatically reduces background fluorescence from the bulk solution, resulting in an exceptionally high signal-to-noise ratio (SNR). This makes TIRF ideal for visualizing processes at or near the plasma membrane, such as vesicle trafficking, cytoskeletal dynamics (e.g., microtubule assembly), and single-molecule interactions.
Table 1: Typical Parameters and Outcomes in TIRF Microscopy
| Parameter | Typical Value / Range | Impact on Experiment |
|---|---|---|
| Penetration Depth (d) | 60 - 200 nm | Controls optical section thickness; shallower depth yields lower background. |
| Exponential Decay Constant | 1/e (37%) per distance d | Fluorescence intensity drops rapidly with distance from coverslip. |
| Signal-to-Noise Ratio (SNR) Gain | 5x to 10x+ vs. epi-fluorescence | Enables detection of single fluorophores and weak interactions. |
| Common Laser Wavelengths | 405, 488, 561, 640 nm | Matched to common fluorophores (DAPI, GFP, RFP, Cy5). |
| Typical Frame Rate | 10 - 100 Hz (up to 1000 Hz for sCMOS) | Suitable for tracking fast dynamic processes like motor protein movement. |
Detailed Protocol: Microtubule Dynamics & Kinesin Motility Assay
This protocol outlines a foundational in vitro reconstitution assay for studying microtubule polymerization dynamics and the processive movement of kinesin motor proteins, a common application in drug discovery targeting the cytoskeleton.
Objective: To visualize real-time, label-free microtubule polymerization from stabilized seeds and subsequent processive motility of fluorescently labeled kinesin motors.
Materials and Reagent Solutions
Table 2: Research Reagent Solutions for TIRF Microtubule Assay
| Reagent / Material | Function / Description | Example Source / Notes |
|---|---|---|
| High-Purity Tubulin | Core protein subunit for microtubule polymerization. Often labeled with a fluorophore (e.g., Alexa 488, HiLyte 647). | Cytoskeleton Inc., PurSolutions. |
| GMPCPP-Stabilized Microtubule Seeds | Short, non-dynamic microtubule fragments that serve as nucleation points for dynamic growth. | Prepared in-lab from tubulin + GMPCPP nucleotide. |
| ATP-Regenerating System | Maintains constant ATP levels for sustained kinesin motor activity. | Creatine phosphate & creatine phosphokinase. |
| Oxygen Scavenging System | Reduces photobleaching and phototoxicity (e.g., PCA/PCD/Trolox). | Essential for single-molecule imaging longevity. |
| Passivation Reagent (e.g., PEG, Pluronic F-127) | Coats flow chamber surface to prevent non-specific protein adhesion. | Biotinylated-PEG used for biotin-streptavidin tethering. |
| Streptavidin | Links biotinylated surface to biotinylated seeds or motors. | Thermo Fisher Scientific. |
| Fluorescently Labeled Kinesin Construct | Engineered motor protein (e.g., Kinesin-1) with a fluorescent tag (e.g., GFP, mCherry). | Expressed and purified in-lab or commercial. |
| Imaging Buffer | BRB80 (80 mM PIPES, 1 mM MgCl₂, 1 mM EGTA, pH 6.8) with adjustments for ATP, oxygen scavengers, and an antifade system. |
Step-by-Step Experimental Methodology
A. Flow Chamber Preparation
- Construct a flow chamber by adhering a glass coverslip (#1.5H, high precision) to a microscope slide using double-sided tape.
- Flush chamber with 0.2% Pluronic F-127 in BRB80 for 5 minutes to passivate the glass surface. Rinse with BRB80.
- (Optional, for seed tethering): Flush with 0.5 mg/mL NeutrAvidin in BRB80, incubate 2 min, rinse. Biotinylated seeds will bind specifically.
B. Microtubule Polymerization Assay
- Prepare tubulin growth mix: Unlabeled tubulin (e.g., 10-15 µM) mixed with a small fraction (typically 0.5-5%) of fluorescently labeled tubulin in BRB80, supplemented with 1 mM GTP and oxygen scavenging system.
- Introduce the tubulin growth mix into the flow chamber.
- Initiate TIRF imaging immediately using the appropriate laser line (e.g., 488 nm for Alexa 488-tubulin). Focus on the chamber surface.
- Microtubules will grow dynamically from any nucleating seeds or spontaneously. Data Acquisition: Acquire time-lapse images (1 frame every 2-5 seconds) for 10-20 minutes. Analyze growth/shrinkage rates and catastrophe frequencies.
C. Kinesin Motility Assay
- Prepare motility assay mix: Imaging buffer containing an ATP-regenerating system, oxygen scavengers, antifade, fluorescent kinesin motors (0.5-10 nM), and optionally, taxol-stabilized microtubules.
- If using tethered microtubules from Step B, flush chamber with motility assay mix containing kinesin but no free microtubules.
- Initiate simultaneous dual-color TIRF imaging (e.g., 561 nm for microtubules, 640 nm for kinesin). Data Acquisition: Acquire high-speed time-lapse images (10-30 frames per second) to track processive movement of individual kinesin molecules along microtubules. Analyze run length and velocity.
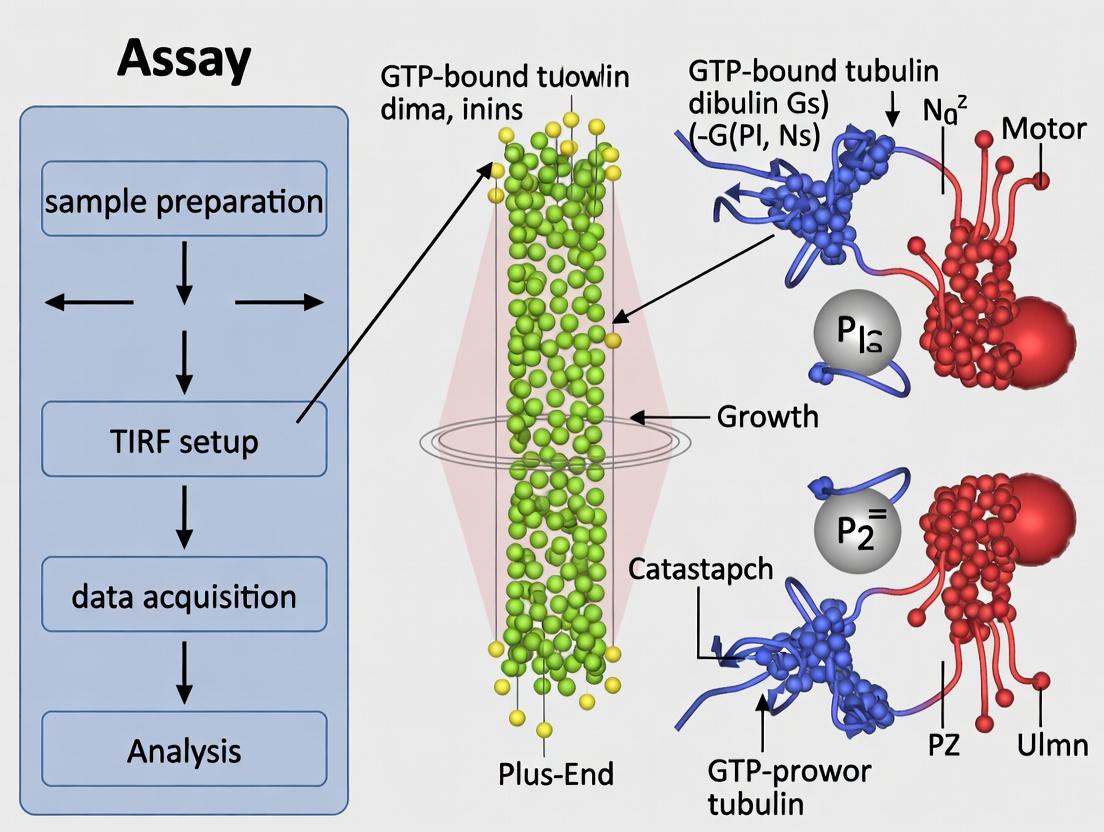
Visualization of Key Concepts and Workflows
TIRF Microtubule Assay Workflow
Principle of Evanescent Field Generation
TIRF Data Informs Drug Mechanism
Why TIRF for Microtubules? Advantages Over Widefield and Confocal Microscopy.
Total Internal Reflection Fluorescence (TIRF) microscopy has become an indispensable tool for studying microtubule dynamics and associated proteins. Within the context of a broader thesis on TIRF microscopy microtubule dynamics assay research, this application note delineates the critical advantages of TIRF over widefield epi-fluorescence and laser scanning confocal microscopy. By exploiting the evanescent field generated at the coverslip-sample interface, TIRF achieves exceptional signal-to-noise ratio (SNR) and axial resolution, enabling the visualization of single fluorophore-tagged tubulin subunits and the precise dynamics of microtubule plus-end tracking proteins (+TIPs) in vitro and in live cells.
Comparative Advantages of TIRF Microscopy
The following table summarizes the quantitative and qualitative advantages of TIRF for microtubule studies compared to other common microscopy modalities.
Table 1: Comparison of Microscopy Modalities for Microtubule Imaging
| Feature | Widefield Epi-Fluorescence | Laser Scanning Confocal | TIRF Microscopy |
|---|---|---|---|
| Excitation Volume | Large cone; entire sample depth | Elongated hourglass; restricted by pinhole | Thin evanescent field (~70-200 nm from coverslip) |
| Axial (z) Resolution | ~500-700 nm | ~500-700 nm | ~100 nm |
| Out-of-Focus Blur | Severe | Mostly eliminated | Virtually eliminated |
| Signal-to-Noise Ratio (SNR) for surface events | Low | Moderate | Very High |
| Photobleaching & Phototoxicity | High (entire sample) | Moderate (confined to focal plane) | Low (only thin section) |
| Temporal Resolution | Very High | Limited by scanning | High |
| Ideal Application | Overview imaging, fixed cells | 3D reconstruction of thick samples | Single-molecule dynamics, membrane/interface events |
| Typical Penetration Depth | Unlimited (within working distance) | Adjustable by pinhole | Fixed, 70-200 nm |
Key Protocols for Microtubule Dynamics Assays
Protocol 1: In Vitro Microtubule Polymerization & TIRF Imaging
This protocol details the preparation of dynamic microtubules for TIRF-based visualization of polymerization dynamics and +TIP protein interactions.
Materials:
- Purified tubulin (e.g., porcine brain, recombinant), labeled with a bright, photostable fluorophore (e.g., Alexa Fluor 647, TAMRA) and unlabeled.
- BRB80 buffer (80 mM PIPES, 1 mM MgCl₂, 1 mM EGTA, pH 6.8 with KOH).
- GTP (Guanosine-5'-triphosphate).
- Antifade system (e.g., glucose oxidase/catalase with β-mercaptoethanol).
- Flow chamber assembled from a silanized coverslip and a glass slide using double-sided tape.
- TIRF microscope with appropriate lasers, high NA objective (≥1.45), and sensitive EMCCD or sCMOS camera.
Procedure:
- Flow Chamber Preparation: Passivate the chamber with 1% Pluronic F-127 in BRB80 for 5 min to prevent nonspecific protein adhesion.
- Microtubule Seeds Formation: Introduce 0.5 mg/mL biotinylated tubulin in BRB80 with 1 mM GTP. Incubate 5 min. Flush with BRB80. Introduce 0.5 mg/mL streptavidin. Incubate 2 min. Flush. This creates biotin-streptavidin-biotin tubulin "seeds" immobilized on the surface.
- Dynamic Microtubule Growth: Prepare growth mix: 10-20 μM tubulin (containing ~10% labeled tubulin), 1 mM GTP, and antifade components in BRB80. Introduce into the chamber.
- TIRF Imaging: Mount chamber on microscope stage. Adjust TIRF angle to achieve optimal evanescent field penetration (~100 nm). Acquire time-lapse images (e.g., 1-5 sec intervals) using low laser power to minimize photobleaching.
Protocol 2: Live-Cell Microtubule Plus-End Tracking (+TIP) Assay
This protocol outlines the procedure for imaging the dynamics of fluorescently tagged +TIP proteins (e.g., EB3, CLIP-170) in living cells using TIRF.
Materials:
- Cultured cells (e.g., U2OS, RPE-1).
- Expression plasmid for +TIP protein fused to a bright fluorescent protein (e.g., EB3-mEGFP, mCherry-CLIP-170).
- Transfection reagent.
- Phenol-red free imaging medium.
- TIRF microscope with environmental chamber (37°C, 5% CO₂).
Procedure:
- Cell Preparation: Plate cells on high-quality, #1.5 thickness coverslips 24-48 hours before imaging.
- Transfection: Transfect cells with the +TIP fusion construct using standard protocols. Optimal expression levels are critical; too high leads to background, too low leads to poor SNR. Image 18-24 hours post-transfection.
- Mounting for Imaging: Assemble coverslip in an imaging chamber with phenol-red free medium.
- TIRF Imaging & Analysis: Place chamber on the TIRF microscope. Adjust the TIRF angle to selectively illuminate the basal cellular cortex where microtubules contact the adhesion surface. Acquire high-speed time-lapse images (100-500 ms intervals). Use kymograph analysis to quantify microtubule growth speed and +TIP comet dwell times.
The Scientist's Toolkit: Key Reagent Solutions
Table 2: Essential Research Reagents for TIRF Microtubule Assays
| Reagent / Material | Function & Rationale |
|---|---|
| High-Purity Tubulin (e.g., Cytoskeleton Inc.) | The fundamental building block. Consistency in purity and polymerization competence is critical for reproducible dynamics. |
| Photostable Fluorophore-Labeled Tubulin (e.g., Hilyte Fluor 488, Cy3) | Enables visualization. Brightness and photostability are paramount for single-molecule or polymer tracking over time. |
| BRB80 or PEM Buffer | Standard, physiologically relevant buffer for microtubule polymerization that maintains tubulin stability. |
| Glucose Oxidase/Catalase Oxygen Scavenging System | Essential antifade reagent for in vitro assays. Reduces photobleaching and oxygen radical-induced damage during prolonged imaging. |
| Pluronic F-127 | Non-ionic surfactant used to passivate surfaces, preventing nonspecific sticking of tubulin and proteins to the flow chamber. |
| Biotinylated Tubulin & Streptavidin | Used to create immobilized microtubule "seeds" on a biotin-BSA coated surface for in vitro assays, providing nucleation points. |
| EB3-mEGFP Plasmid | Standard molecular tool for visualizing growing microtubule plus-ends in live cells. EB3 is the canonical +TIP protein. |
| #1.5 High-Precision Coverslips (170 μm ± 5 μm) | Critical for optimal TIRF illumination. Inconsistent thickness alters the critical angle and degrades evanescent field quality. |
Workflow and Pathway Diagrams
Diagram 1: TIRF vs Widefield Optical Path Decision Logic
Diagram 2: TIRF Assay for In Vitro Microtubule Dynamics
Diagram 3: TIRF Selective Illumination of Cortical Microtubules
Key Components of a TIRF Microscope System for Live-Cell Assays
This document, framed within a broader thesis on TIRF microscopy for microtubule dynamics assay research, details the key components, application notes, and protocols for Total Internal Reflection Fluorescence (TIRF) microscopy systems optimized for live-cell assays. TIRF's ability to selectively excite fluorophores within a thin evanescent field (~100-200 nm) adjacent to the coverslip makes it indispensable for visualizing subcellular processes like microtubule dynamics, vesicle trafficking, and membrane receptor behavior with exceptional signal-to-noise ratio.
Key System Components & Quantitative Specifications
A modern TIRF system for live-cell research integrates several critical hardware and software modules. The specifications are summarized in the table below.
Table 1: Core Components of a TIRF Microscope System for Live-Cell Assays
| Component | Key Features & Specifications | Role in Live-Cell TIRF Assay |
|---|---|---|
| Laser Launch | 4-6 laser lines (e.g., 405, 488, 561, 640 nm); AOTF or AOBS for rapid switching & intensity control; single-mode polarization-maintaining fiber for clean, stable beam profile. | Provides high-intensity, monochromatic excitation for multiplexed imaging. Precise control minimizes phototoxicity. |
| Microscope Frame | Motorized, inverted stand; high numerical aperture (NA ≥ 1.45) TIRF-specific oil-immersion objective; perfect alignment for multi-color TIRF. | High NA objective is critical for generating a thin, high-intensity evanescent field. Stability prevents drift during time-lapse. |
| TIRF Illuminator | Motorized, computer-controlled angle adjustment; simultaneous multi-angle (SA) TIRF or highly inclined thin illumination (HILO) capability; precise azimuthal control. | Enables fine-tuning of evanescent field depth (typically 70-150 nm) for different cell structures and penetration needs. |
| Camera | High quantum efficiency (≥82%) sCMOS or EMCCD; fast readout (≥100 fps at full frame); low read noise (<1 e- for EMCCD, ~1.5 e- for sCMOS). | Captures rapid, low-light events (e.g., microtubule growth) with high sensitivity and temporal resolution. |
| Environmental Control | Full enclosure; heated stage and objective lens; CO₂ and humidity control (for non-sealed dishes). | Maintains cell viability and normal physiology during extended live-cell imaging (minutes to hours). |
| Software | Integrated acquisition for hardware control; real-time analysis for TIRF angle alignment and drift correction; modules for single-molecule tracking and kymograph analysis. | Enables reproducible protocol execution and immediate quantitative analysis of dynamics (e.g., microtubule growth/shrinkage rates). |
Application Notes: Microtubule Dynamics Assay
Context: In drug development, particularly for anti-cancer agents targeting the cytoskeleton, quantifying microtubule dynamics is crucial. TIRF is ideal for imaging EB protein-labeled growing microtubule plus-ends in living cells against a dark cytoplasmic background.
Critical Considerations:
- Cell Line & Plating: Use low-passage, well-adhering cells (e.g., U2OS, RPE-1). Plate sparsely on high-quality, cleaned #1.5H glass-bottom dishes 24-48 hours prior.
- Fluorophore Selection: Use bright, photostable fluorophores (e.g., mNeonGreen, mScarlet). Fuse to a microtubule plus-end tracking protein like EB3 for dynamics measurement.
- Phototoxicity Management: Use the lowest laser power and longest exposure time compatible with the desired frame rate (typically 1-5% laser power, 50-100 ms exposure). Employ sensitive cameras to allow dose reduction.
Detailed Protocol: Live-Cell Microtubule Dynamics Imaging
Aim: To acquire time-lapse TIRF images of growing microtubule plus-ends for quantitative analysis of dynamic instability parameters.
Research Reagent Solutions: Table 2: Essential Materials for Microtubule Dynamics Assay
| Item | Function & Example |
|---|---|
| Glass-Bottom Dish | High-precision #1.5H (0.17 mm) coverslip for optimal TIRF illumination and optical clarity. |
| Fluorescent Probe | Plasmid: EB3-mNeonGreen or EB3-mScarlet. Labels dynamically growing microtubule plus-ends. |
| Transfection Reagent | Lipid-based (e.g., Lipofectamine 3000) or electroporation system for efficient, low-toxicity delivery. |
| Live-Cell Imaging Medium | Phenol-red free medium, buffered with HEPES or CO₂-independent formulation, supplemented with serum. |
| Microtubule-Targeting Agent (Optional) | Positive control: Nocodazole (depolymerizer) or Paclitaxel/Taxol (stabilizer). For assay validation. |
Protocol Workflow:
Cell Preparation & Transfection (Day -1):
- Plate cells in a glass-bottom dish at 30-40% confluence.
- 4-6 hours post-plating, transfect with the EB3-fluorophore plasmid using manufacturer's protocol optimized for minimal cytotoxicity.
- Incubate overnight (16-24 hours).
Microscope Preparation (Day of Experiment):
- Power on the TIRF system, lasers, and environmental chamber at least 1 hour before imaging to ensure thermal stability.
- Pre-warm live-cell imaging medium and PBS to 37°C.
- Place a drop of immersion oil on the TIRF objective. Calibrate the TIRF angle using fluorescent beads or a bare slide coated with a thin fluorescent layer to achieve the desired evanescent field depth (~100 nm is standard for cell imaging).
Sample Mounting & Alignment:
- Carefully replace the culture medium in the dish with pre-warmed imaging medium.
- Mount the dish on the microscope stage.
- Using widefield epi-illumination, locate a field of healthy, moderately expressing cells.
- Switch to TIRF illumination. Fine-tune the laser incident angle until background cytoplasmic fluorescence is minimized, and only adhesions and microtubules near the basal membrane are visible.
Image Acquisition:
- Set acquisition parameters: 561 nm laser (for mScarlet) at 2-5% power, 50-100 ms exposure, sCMOS camera in fast-readout mode.
- Acquire a time-lapse series: 500 frames at 2-second intervals (total 16.5 minutes).
- For multi-position experiments, define 5-10 fields of view prior to starting the time-lapse.
Post-Acquisition & Analysis:
- Correct for stage drift using a cross-correlation algorithm.
- Generate kymographs (distance-time plots) along microtubule trajectories using line tools in analysis software (e.g., Fiji/ImageJ with KymoButler or MetaMorph).
- Quantify dynamic instability parameters from kymographs: growth rate, shrinkage rate, catastrophe frequency, and rescue frequency.
Visualization of Workflow and Pathways
TIRF Assay Workflow for Microtubule Dynamics
Microtubule Dynamic Instability Pathway
Within the context of TIRF microscopy-based assays for microtubule dynamics, the selection of appropriate fluorescent probes is critical for achieving high signal-to-noise ratio, minimal perturbation, and physiological relevance. This application note details key fluorescent labels and protocols for visualizing microtubules in vitro and in live cells.
Key Research Reagent Solutions
The following table lists essential reagents and their functions for microtubule TIRF assays.
| Reagent/Category | Example Product/Name | Key Function in Assay |
|---|---|---|
| Fluorescent Tubulin | GFP-α-Tubulin (Cytoskeleton, Inc.) | Genetically encoded label for live-cell microtubule dynamics. |
| Fluorescent Tubulin | HiLyte Fluor 488/647 Tubulin (Cytiva) | Bright, photo-stable label for in vitro TIRF assays. |
| Live-Cell Compatible Dye | SiR-tubulin (Spirochrome) | Far-red, cell-permeable fluorogen for super-resolution and long-term live imaging. |
| Microtubule Stabilizer | Paclitaxel (Taxol) | Stabilizes microtubules for static structural studies. |
| Dynamic Buffer | BRB80 (80 mM PIPES) | Standard physiological buffer for microtubule polymerization. |
| Oxygen Scavenger | Glucose Oxidase/Catalase (GOC) | Reduces photobleaching in in vitro TIRF assays. |
| TIRF-Compatible Chamber | µ-Slide 8 Well (ibidi) | Glass-bottom chamber for high-resolution imaging. |
| Blocking Agent | Pluronic F-127 | Prevents non-specific adsorption in flow chambers. |
| Nucleotide Regenerator | Protocatechuate-3,4-dioxygenase (PCD)/Protocatechuic Acid (PCA) | Advanced oxygen scavenging system for prolonged imaging. |
Quantitative Probe Comparison
The table below summarizes key characteristics of featured fluorescent probes for microtubules.
| Probe Name | Excitation/Emission (nm) | Primary Use | Key Advantage | Key Limitation |
|---|---|---|---|---|
| GFP-Tubulin | 488/510 | Live-cell dynamics | Genetically encoded; non-perturbing at low expression. | Requires transfection; potential overexpression artifacts. |
| SiR-Tubulin | 650/680 | Live-cell SR/TIRF | Cell-permeable; low background; far-red emission. | Requires serum-free pre-incubation; weaker signal in some cell types. |
| HiLyte 647-Tubulin | 650/670 | In vitro TIRF | High brightness & photostability; direct incorporation. | Not cell-permeable; for reconstituted systems only. |
| Alexa Fluor 488-Tubulin | 495/519 | In vitro TIRF | Very bright; high degree of labeling. | Not cell-permeable; potential polymerization inhibition at high labeling %. |
Detailed Experimental Protocols
Protocol 1: In Vitro Microtubule Dynamics Assay using HiLyte 647-Tubulin (TIRF Microscopy)
Objective: To visualize dynamic microtubule growth from stabilized seeds in a flow chamber.
Materials:
- Purified tubulin (e.g., from Cytoskeleton, Inc.)
- HiLyte 647-labeled tubulin (e.g., from Cytiva)
- Unlabeled bovine brain tubulin
- BRB80 buffer (80 mM PIPES, 1 mM MgCl2, 1 mM EGTA, pH 6.8 with KOH)
- GMPCPP (a non-hydrolyzable GTP analog)
- Taxol-stabilized microtubule seeds (pre-formed with 20% labeled tubulin)
- Flow chamber (assembled from glass slide, coverslip, and double-sided tape)
- TIRF microscope with 640 nm laser and EMCCD/sCMOS camera.
- Oxygen scavenging system: GOC (Glucose Oxidase/Catalase) or PCD/PCA.
Procedure:
- Seed Preparation: Polymerize a mix of 80% unlabeled and 20% HiLyte 647-tubulin in BRB80 with 1 mM GMPCPP at 37°C for 1 hour. Stabilize with 20 µM taxol. Dilute seeds 1:100 in BRB80-Taxol for use.
- Flow Chamber Preparation: Passivate the chamber with 1 mg/mL Pluronic F-127 in BRB80 for 10 minutes to prevent non-specific sticking.
- Seed Adhesion: Flow in diluted seeds. Allow to adhere for 5 minutes.
- Wash: Wash chamber with 3 chamber volumes of BRB80.
- Prepare Dynamic Mix: On ice, prepare imaging mix containing: 12 µM unlabeled tubulin, 1.5 µM HiLyte 647-tubulin (10-15% labeled), 1 mM GTP, oxygen scavenging system (e.g., 0.2 mg/mL glucose oxidase, 0.035 mg/mL catalase, 40 mM D-glucose), and 1% β-mercaptoethanol in BRB80.
- Initiate Dynamics: Flow the imaging mix into the chamber. Seal the chamber with VALAP or grease.
- Image Acquisition: Mount chamber on pre-warmed (37°C) TIRF stage. Use near-critical angle TIRF illumination with a 640 nm laser. Acquire time-lapse images (e.g., 1-3 second intervals) for 10-20 minutes.
Protocol 2: Live-Cell Microtubule Imaging with SiR-Tubulin
Objective: To label and image microtubule dynamics in live mammalian cells with minimal phototoxicity.
Materials:
- Adherent cells (e.g., U2OS, RPE-1) cultured in appropriate medium.
- SiR-tubulin stock solution (Spirochrome, typically 1 mM in DMSO).
- Serum-free imaging medium (e.g., FluoroBrite DMEM).
- Verapamil (optional, to enhance dye uptake in difficult cells).
- Confocal or TIRF microscope with 640 nm laser.
Procedure:
- Cell Preparation: Plate cells on high-quality glass-bottom dishes 24-48 hours before imaging to reach 50-70% confluency.
- Dye Loading: Dilute SiR-tubulin in serum-free imaging medium to a final concentration of 100-500 nM. For stubborn cell lines, add 10 µM verapamil.
- Staining: Replace cell culture medium with the dye-containing medium. Incubate cells at 37°C, 5% CO2 for 1-2 hours.
- Wash & Equilibrate: Replace staining medium with fresh, pre-warmed serum-free imaging medium. Equilibrate for 15-30 minutes to reduce background.
- Image Acquisition: Image using a 640 nm laser line. For TIRF, use low laser power (0.5-5%) to minimize phototoxicity during long-term time-lapse acquisition (e.g., 5-10 second intervals).
Diagrams
Title: Decision Workflow for Selecting a Microtubule Probe
Title: In Vitro Microtubule TIRF Assay Protocol Steps
Title: Factors Influencing Microtubule Dynamics in TIRF Assays
Step-by-Step Protocol: Setting Up a TIRF Assay for Microtubule Dynamics
Within the broader thesis research on TIRF microscopy-based microtubule dynamics assays, reproducible sample preparation is the critical foundation. The assay aims to quantify parameters of microtubule growth, shrinkage, and pausing, and to assess the impact of novel pharmacological agents in drug development. Consistency in cell line handling, seeding, transfection of fluorescent probes (e.g., EB3-GFP, mCherry-α-tubulin), and subsequent staining protocols directly dictates the signal-to-noise ratio, cell health, and validity of quantitative kinetic data extracted via TIRF microscopy.
Cell Line Selection & Culture
For microtubule dynamics studies, commonly used cell lines are epithelial or fibroblast-derived, providing a flat morphology ideal for TIRF imaging.
Recommended Cell Lines
| Cell Line | Origin | Key Advantages for TIRF Microtubule Assays | Typical Culture Medium |
|---|---|---|---|
| COS-7 | African green monkey kidney fibroblast | Large, flat cytoplasm; robust transfection efficiency; excellent for visualizing microtubule networks. | DMEM + 10% FBS + 1% P/S |
| U2OS | Human osteosarcoma epithelial | Adherent, flat cells; consistent tubulin expression; suitable for live-cell and fixed assays. | McCoy's 5A + 10% FBS + 1% P/S |
| HeLa | Human cervical adenocarcinoma epithelial | Well-characterized; high proliferation rate; widely used in cytoskeleton studies. | DMEM + 10% FBS + 1% P/S |
| RPE-1 (hTERT immortalized) | Human retinal pigment epithelial | Near-diploid, stable karyotype; normal cell cycle regulation; ideal for physiologically relevant dynamics. | DMEM/F-12 + 10% FBS + 1% P/S |
Cell Culture Protocol
- Maintenance: Culture cells in T-75 flasks at 37°C, 5% CO₂. Passage at ~80-90% confluence using 0.25% Trypsin-EDTA.
- For Assays: Use cells between passages 5-25. Ensure mycoplasma testing is negative quarterly.
Seeding Density Optimization
Incorrect seeding density leads to overcrowding or excessive cell spreading, compromising single-cell analysis and introducing paracrine effects.
Quantitative Seeding Guidelines
| Cell Line | Recommended Density for 35mm Glass-bottom Dish (µ-Dish) | Approx. Cells/cm² | Expected Confluence at 24h (Transfection) | Expected Confluence at 48h (Imaging) |
|---|---|---|---|---|
| COS-7 | 1.5 x 10⁵ cells/dish | 25,000 | 40-50% | 70-80% |
| U2OS | 1.8 x 10⁵ cells/dish | 30,000 | 50-60% | 80-90% |
| HeLa | 2.0 x 10⁵ cells/dish | 33,000 | 60-70% | 90-100% |
| RPE-1 | 2.2 x 10⁵ cells/dish | 37,000 | 50-60% | 85-95% |
Protocol: Seeding for TIRF Assay
- Day -2: Trypsinize a healthy, sub-confluent flask of cells.
- Count using a hemocytometer or automated cell counter.
- Prepare a cell suspension in complete growth medium (without antibiotics if proceeding to lipid-based transfection).
- Seed the required number of cells into 35mm glass-bottom dishes pre-warmed with 2mL medium.
- Gently rock the dish to ensure even distribution.
- Place dishes in the 37°C, 5% CO₂ incubator and allow to adhere for 18-24 hours before transfection.
Transfection for Live-Cell TIRF Imaging
Transfection introduces fluorescently tagged proteins to visualize microtubule plus-ends or the microtubule lattice.
Common Fluorescent Constructs
| Construct | Target | Function in Assay | Typical Plasmid |
|---|---|---|---|
| EB3-GFP/mNeonGreen | Microtubule plus-ends | Marker of growing microtubule ends. Allows quantification of growth velocity and catastrophe frequency. | pEGFP-N1-EB3 |
| mCherry-α-Tubulin | Microtubule lattice | Labels the entire microtubule polymer. Enables visualization of overall network architecture and shrinkage events. | pmCherry-C1-TUBA1A |
| HaloTag/JF Dye-Tubulin | Microtubule lattice | Covalent, bright labeling for single-molecule or high-temporal-resolution imaging. | pHTC-TUBA1A |
Detailed Transfection Protocol (Lipid-based)
This protocol uses Lipofectamine 3000 for COS-7 cells. Optimize reagent ratios for other lines.
Materials: Opti-MEM, Lipofectamine 3000 reagent, P3000 reagent, plasmid DNA. Workflow:
- Day -1 (24h post-seeding): Check cell confluence (~40-60% ideal).
- For each dish, prepare two sterile tubes:
- Tube A (DNA Mix): 250µL Opti-MEM + 1.5µg plasmid DNA + 4µL P3000 Reagent.
- Tube B (Lipid Mix): 250µL Opti-MEM + 3.75µL Lipofectamine 3000.
- Combine Tube A and Tube B. Mix gently. Incubate at RT for 15 min.
- Remove medium from the cell dish and replace with 1.5mL fresh, pre-warmed complete medium without antibiotics.
- Add the 500µL DNA-lipid complex dropwise onto the medium. Swirl gently.
- Incubate cells at 37°C, 5% CO₂ for 4-6 hours.
- Replace transfection medium with 2mL fresh, pre-warmed complete medium with antibiotics.
- Incubate for 18-48 hours before imaging. Expression peak is typically 24-36h post-transfection.
TIRF Sample Preparation Workflow
Immunofluorescence Staining for Fixed-Cell Assays
Used to visualize endogenous proteins (e.g., post-translational modifications of tubulin, associated proteins) or when transfection is inefficient.
Detailed Staining Protocol
Solutions Required: 1x PBS, 4% Formaldehyde (freshly prepared or aliquoted), 0.1-0.5% Triton X-100 in PBS, Blocking Buffer (3% BSA, 0.1% Tween-20 in PBS), Primary Antibody, Fluorescent Secondary Antibody, DAPI (1µg/mL), Anti-fade Mountant.
Workflow:
- Fixation: Aspirate medium. Rinse cells gently with 2mL warm PBS. Add 1mL 4% formaldehyde in PBS. Incubate 15 min at RT.
- Permeabilization: Aspirate fixative. Wash 3x with PBS (5 min each). Add 1mL 0.3% Triton X-100 in PBS. Incubate 10 min at RT.
- Blocking: Aspirate permeabilization solution. Wash 1x with PBS. Add 1mL Blocking Buffer. Incubate 60 min at RT.
- Primary Antibody: Prepare primary antibody (e.g., Anti-acetylated Tubulin, Anti-tyrosinated Tubulin) in Blocking Buffer at manufacturer-recommended dilution. Apply 200-300µL per dish. Incubate overnight at 4°C in a humidified chamber.
- Wash: Remove antibody solution. Wash 3x with PBS + 0.1% Tween-20 (5 min each).
- Secondary Antibody: Prepare fluorophore-conjugated secondary antibody (e.g., Alexa Fluor 488, 568) and DAPI in Blocking Buffer. Apply 200-300µL per dish. Incubate for 60 min at RT in the dark.
- Final Wash: Remove secondary antibody. Wash 3x with PBS + 0.1% Tween-20 (5 min each in the dark). Perform a final wash with PBS alone.
- Mounting: For dishes with removable glass coverslips, mount on slides with anti-fade reagent. For permanent glass-bottom dishes, add 500µL PBS or anti-fade reagent. Seal edges with clear nail polish if needed. Image within 24h or store at 4°C in the dark.
The Scientist's Toolkit: Research Reagent Solutions
| Item | Function in TIRF Microtubule Assay | Example Product/Specification |
|---|---|---|
| High-Performance Glass-bottom Dishes | Provide optimal optical clarity, refractive index, and thickness for TIRF microscopy objectives. | MatTek P35G-1.5-14-C, Ibidi µ-Dish 35mm high Glass Bottom. |
| Fluorescent Tubulin Probes | Genetically encoded tags for live-cell imaging of microtubule dynamics. | mNeonGreen-EB3 plasmid, mCherry-α-Tubulin plasmid, HaloTag-Tubulin + JF646 ligand. |
| Transfection Reagent | Efficiently delivers nucleic acids into cells with low cytotoxicity for high expression yield. | Lipofectamine 3000, FuGENE HD, JetPrime. |
| Live-Cell Imaging Medium | Maintains pH, osmolality, and cell health during prolonged TIRF imaging without phenol red. | FluoroBrite DMEM, Leibovitz's L-15 Medium, or HEPES-buffered medium. |
| Microtubule-Targeting Agents (Control) | Pharmacological modulators to validate assay sensitivity (e.g., induce stabilization/destabilization). | Paclitaxel (10-100nM), Nocodazole (100nM-1µM). |
| Fixative | Rapidly preserves cellular architecture with minimal perturbation to microtubule structures. | Electron microscopy grade 16-32% Formaldehyde (diluted to 4%). |
| Tubulin Modification Antibodies | Detect specific post-translational modifications correlating with microtubule stability and function. | Anti-acetylated-α-tubulin (Clone 6-11B-1), Anti-tyrosinated-α-tubulin. |
| High-Contrast Anti-fade Mountant | Preserves fluorescence signal intensity and prevents photobleaching during fixed-cell imaging. | ProLong Diamond, SlowFade Gold. |
| SIR-Tubulin / Tubulin Tracker Dyes | Cell-permeable fluorescent dyes for quick, transfection-free labeling of microtubules in live cells. | SIR-Tubulin (Spirochrome), TubulinTracker Green (Invitrogen). |
TIRF Microtubule Assay Experimental Strategies
Within the broader thesis on utilizing Total Internal Reflection Fluorescence (TIRF) microscopy to quantify microtubule dynamics in the context of anti-cancer drug discovery, the reliability of acquired data is paramount. This application note details the critical, often interdependent, setup parameters of laser alignment, penetration depth (evanescent field) calibration, and laser power optimization. Proper execution of these protocols ensures consistent, quantitative imaging of single microtubule filaments with high signal-to-noise ratio, enabling precise tracking of growth, shrinkage, and pausing events in response to therapeutic agents.
TIRF microscopy exploits an evanescent wave to illuminate a thin region (~100 nm) adjacent to the coverslip, minimizing background fluorescence and enabling visualization of sub-cellular structures like microtubules with exceptional clarity. For kinetic assays, three setup factors are critical: (1) Precise laser alignment to achieve true TIRF conditions, (2) Accurate calibration of the evanescent field depth to ensure consistent illumination geometry between experiments, and (3) Careful titration of laser power to minimize photodamage while maintaining sufficient signal for tracking. Failure to rigorously control these variables introduces noise, artifacts, and non-reproducible measurements, compromising drug screening efforts.
Protocols & Methodologies
Protocol 1: Laser Alignment for TIRF Illumination
Objective: To align the laser path to achieve total internal reflection at the sample-coverslip interface.
- Preparation: Place a high-density fluorescent dye sample (e.g., 100 nM Alexa Fluor 488 in aqueous solution) on the microscope. Use the objective lens specified for TIRF (e.g., 100x, NA 1.49).
- Initial Rough Alignment: Switch to widefield epi-illumination and focus on the fluorescent solution. Center the laser beam in the field of view using the upstream steering mirrors.
- Transition to TIRF: Engage the TIRF illumination mechanism (e.g., move the laser beam laterally at the back focal plane of the objective). Observe the fluorescence pattern.
- Fine Adjustment: Adjust the TIRF alignment screws or micrometric mirror controls until a characteristic "half-moon" or asymmetrical illumination pattern is observed, indicating the beam is hitting the edge of the objective's back aperture.
- Final Optimization: Make minute adjustments while monitoring the intensity profile. Optimal TIRF is achieved when the illuminated field becomes a sharply defined, bright, and thin line at the coverslip surface, with background intensity dropping to near zero. Capture an image of the fluorescence profile for records.
Protocol 2: Calibration of Evanescent Field Penetration Depth
Objective: To empirically measure the decay constant (d) of the evanescent field for a given alignment and wavelength.
- Sample Preparation: Image a series of fluorescent beads (e.g., 100 nm Tetraspeck) immobilized at different known distances from the coverslip. This is achieved using a calibrated piezo Z-stage.
- Data Acquisition: For each pre-determined Z-position (e.g., 0, 50, 100, 150, 200 nm above the coverslip), acquire a TIRF image. Use a low laser power to avoid bleaching.
- Analysis: Measure the mean fluorescence intensity (I) of several beads at each Z-position. Fit the data to the exponential decay equation: I(z) = I₀ * exp(-z / d), where z is the distance from the interface, I₀ is the intensity at z=0, and d is the penetration depth.
- Validation: The calculated d should correspond to theoretical values based on the laser wavelength (λ), objective NA, and refractive indices. Re-align if the deviation is >15%.
Table 1: Sample Penetration Depth Calibration Data for 488 nm Laser
| Z-Position (nm) | Mean Fluorescence Intensity (a.u.) | Standard Deviation |
|---|---|---|
| 0 | 10,000 | 850 |
| 50 | 5,512 | 470 |
| 100 | 3,037 | 290 |
| 150 | 1,674 | 180 |
| 200 | 923 | 95 |
| Fitted d (nm) | 98.7 | ± 2.1 |
Protocol 3: Laser Power Titration for Live-Cell Microtubule Imaging
Objective: To determine the maximum laser power that does not induce measurable phototoxicity or photobleaching during time-lapse acquisition.
- Cell Preparation: Seed cells expressing fluorescently tagged tubulin (e.g., GFP-α-tubulin) in imaging chambers.
- Test Acquisition: For a range of laser powers (e.g., 0.5%, 1%, 2%, 5%, 10% of total laser output), acquire a 5-minute time-lapse series (1 frame every 3 seconds).
- Quantitative Assessment:
- Microtubule Dynamics: Track growth rates in each condition. A significant decrease in growth rate at higher powers indicates photodamage.
- Fluorescence Decay: Plot mean cell fluorescence over time. A deviation from a single exponential decay indicates secondary photobleaching effects.
- Cell Viability: Monitor cell morphology post-imaging.
- Selection: Choose the highest laser power that does not alter dynamics, preserves a stable fluorescence signal for the duration of the experiment, and maintains cell health.
Table 2: Laser Power Optimization Results in Live COS-7 Cells
| Laser Power (mW at sample) | Microtubule Growth Rate (µm/min) | Signal Half-Life (s) | Cell Rounding (Post-5min) |
|---|---|---|---|
| 0.5 | 11.2 ± 1.8 | >300 | No |
| 1.0 | 11.0 ± 2.1 | 285 | No |
| 2.0 | 10.5 ± 1.9 | 210 | No |
| 5.0 | 8.1 ± 2.5* | 95 | Mild |
| 10.0 | 5.3 ± 3.1* | 45 | Yes |
*Significant reduction from control (p < 0.01)
The Scientist's Toolkit: Research Reagent Solutions
Table 3: Essential Materials for TIRF Microtubule Dynamics Assays
| Item | Function & Rationale |
|---|---|
| High-NA TIRF Objective (e.g., 100x/1.49 NA) | Collects the faint evanescent wave signal; the NA >1.38 is essential for generating TIRF. |
| Calibrated Piezo Z-Stage | Provides nanometer-precision Z-positioning for penetration depth calibration and stable focus during live imaging. |
| Immersion Oil (Low-autofluorescence, matched RI) | Maintains the critical refractive index matching between objective and coverslip for optimal TIRF performance. |
| #1.5 High-Precision Coverslips (170 µm ± 5 µm) | Thickness is optimized for TIRF objectives; variability introduces spherical aberration and alters TIRF angle. |
| Fluorescent Nanospheres (100 nm, Tetraspeck) | Serve as immobile point sources for alignment checks, penetration depth calibration, and channel registration. |
| Cell Lines with Fluorescently Tagged Tubulin (e.g., GFP-α-tubulin) | Enables visualization of microtubule networks without the need for invasive staining in live cells. |
| Anti-Fade/ Oxygen Scavenging Imaging Media (e.g., with PCA/PCD) | Reduces photobleaching and oxidative photodamage during extended live-cell time-lapse experiments. |
| Microtubule-Stabilizing Buffer (BRB80 with Taxol) | Used in in vitro assays to immobilize microtubules for plus-end tracking protein (EB1) binding studies. |
Visual Workflows
TIRF Setup Critical Path Verification
Physics of TIRF Evanescent Field Generation
Within the context of a TIRF microscopy-based thesis investigating microtubule dynamics, precise acquisition parameter optimization is critical for accurately quantifying dynamic instability parameters (growth speed, shrinkage speed, catastrophe frequency, rescue frequency). Improper settings lead to measurement artifacts, underscoring the need for application-specific protocols.
Quantitative Parameter Guidelines
The following tables consolidate current best-practice parameters for TIRF-based assays of in vitro microtubule dynamics, typically using rhodamine- or Alexa Fluor-labeled tubulin.
Table 1: Core Acquisition Parameters for Standard Dynamic Instability Assays
| Parameter | Recommended Range | Rationale & Impact |
|---|---|---|
| Frame Rate | 0.5 - 2 frames per second (fps) | Balances temporal resolution with photobleaching/phototoxicity. <1 fps may miss short events; >2 fps increases photodamage. |
| Exposure Time | 50 - 500 ms | Must be synchronized with frame rate. Shorter exposures reduce motion blur for fast growth; longer exposures improve signal-to-noise for dim specimens. |
| Total Duration | 300 - 600 seconds | Enables capture of sufficient catastrophe/rescue events for robust statistical analysis (typically >50 events per condition). |
| Laser Power (488/561 nm) | 0.5 - 5% of max (TIRF) | Minimizes fluorophore photobleaching and sample photodamage while maintaining sufficient signal. |
| EMCCD/Gain | 200 - 300 (EMCCD) | Optimizes detection of single microtubules while managing noise. |
| TIRF Penetration Depth | 70 - 150 nm | Confines excitation to evanescent field, reducing background from free tubulin in solution. |
Table 2: Parameter Adjustments for Specific Experimental Goals
| Experimental Goal | Adjusted Parameter | Modified Setting | Justification |
|---|---|---|---|
| High-Speed Dynamics (e.g., drug effects) | Frame Rate | 5-10 fps | Captures rapid transitions and short-lived intermediates. |
| Low Signal Samples (e.g., end-binding proteins) | Exposure Time | 300-500 ms | Integrates more signal per frame to improve SNR. |
| Long-Term Stability Assays | Total Duration | 900-1800 s | Assesses microtubule behavior over extended periods, requiring robust fluorophores and oxygen scavenging. |
| Minimizing Photodamage | Laser Power | <0.5% (TIRF) | Uses lowest power that yields measurable polymer; critical for delicate complexes. |
Detailed Experimental Protocol: TIRF Microscopy Microtubule Dynamics Assay
Materials & Reagent Solutions
Research Reagent Solutions Toolkit
| Item | Function & Specification |
|---|---|
| Purified Tubulin | Rhodamine- or Alexa Fluor 568-labeled porcine/bovine brain tubulin. High labeling ratio (≥90%) is critical for bright, specific signal. |
| BRB80 Buffer | (80 mM PIPES, 1 mM MgCl2, 1 mM EGTA, pH 6.8 with KOH) Standard microtubule stabilization and polymerization buffer. |
| Glucose Oxidase/Catalase System | Oxygen scavenging system to reduce photobleaching (e.g., 40 mM glucose, 0.4 mg/mL catalase, 0.2 mg/mL glucose oxidase in BRB80). |
| Trolox or Ascorbic Acid | Alternative/adjunct radical scavenger to further enhance fluorophore stability. |
| Casein or Pluronic F-127 | Passivating agent to prevent nonspecific adhesion of tubulin to flow chamber surfaces. |
| Anti-Tubulin Antibody | Surface immobilization agent. Unlabeled primary antibody binds to coverslip, capturing microtubules for imaging in the TIRF field. |
| Guanosine-5'-[(α,β)-methyleno]triphosphate (GMPCPP) | Non-hydrolyzable GTP analog used to seed microtubule growth, creating stable nucleation points. |
| Adenosine 5'-triphosphate (ATP) & Regeneration System | Required if assay includes microtubule-associated proteins (MAPs) or kinesins that hydrolyze ATP. |
| Methylcellulose | Optional crowding agent to reduce microtubule diffusion and keep polymers near the coverslip surface. |
| Flow Chamber | Constructed from a glass slide, double-sided tape, and a functionalized #1.5 high-precision coverslip. |
Step-by-Step Procedure
Day 1: Microscope and Chamber Preparation
- Coverslip Functionalization: Clean coverslips via sonication in 1 M KOH, rinse with Milli-Q water, and dry. Incubate with 0.01% poly-L-lysine-PEG-biotin for 15 min, rinse.
- Flow Chamber Assembly: Assemble chamber using double-sided tape. Flow in 0.5 mg/mL streptavidin, incubate 5 min, wash with BRB80.
- Microscope Setup: Align TIRF illuminator (488/561/640 nm lasers). Calibrate TIRF angle for ~100 nm penetration depth. Set environmental chamber to 35°C.
Day 2: Sample Preparation and Imaging
- Microtubule Seed Preparation: Mix unlabeled and labeled tubulin (10% labeled) in BRB80 with 1 mM GMPCPP. Incubate at 37°C for 45 min. Pellet seeds, resuspend in BRB80.
- Surface Seeding: Flow biotinylated anti-tubulin antibody into chamber (5 min). Wash. Flow in GMPCPP-stabilized seeds (5 min). Wash with BRB80.
- Prepare Imaging Mix: Combine BRB80, 1 mM GTP, oxygen scavenging system, 0.2% casein, labeled tubulin (10-20 µM final, 10-20% labeled), and any drug/protein of interest. Centrifuge briefly before use.
- Initiate Reaction & Image: Flow imaging mix into chamber and immediately transfer to microscope. Start acquisition using parameters from Table 1 (e.g., 1 fps, 200 ms exposure, 10 min total, 561 nm laser at 2% power).
- Data Acquisition: Save data in an uncompressed format (e.g., .tif stack). Record metadata precisely.
Data Analysis Workflow
- Microtubule Tracking: Use open-source (TrackMate in Fiji) or commercial (MetaMorph, Imaris) software to track plus-end positions over time.
- Life History Plot Generation: Generate kymographs or plot end position vs. time.
- Parameter Extraction: From life histories, calculate:
- Growth Velocity (µm/min)
- Shrinkage Velocity (µm/min)
- Catastrophe Frequency (events/min)
- Rescue Frequency (events/min)
- Dynamicity (total tubulin exchange)
- Statistical Comparison: Use non-parametric tests (Mann-Whitney U) to compare parameters between control and experimental conditions (n≥50 events per condition).
Visualization of Protocols and Pathways
Title: TIRF Microtubule Dynamics Assay Workflow
Title: Parameter Impact on Data Quality in TIRF Assays
Title: Microtubule Dynamic Instability Cycle & Measurement Points
Application Notes
Thesis Context
Within the framework of a TIRF microscopy-based thesis on microtubule dynamics, precise quantification of kinetic parameters is fundamental. This analysis directly tests hypotheses regarding regulatory protein function, drug mechanisms of action, and intrinsic cytoskeleton behavior. The metrics defined here serve as the primary quantitative readout for comparing experimental conditions.
Core Quantitative Parameters
The dynamic instability of microtubules is characterized by four primary parameters, derived from time-lapse TIRF imaging of individual microtubule ends.
Table 1: Core Microtubule Dynamic Instability Parameters
| Parameter | Definition | Typical Unit | Biological Interpretation |
|---|---|---|---|
| Growth Rate | The rate of tubulin addition during a growth phase. | µm/min | Reflects the efficiency of tubulin dimer incorporation, influenced by GTP-tubulin concentration, MAPs, and stabilizing drugs. |
| Shrinkage Rate | The rate of tubulin loss during a catastrophe-induced shrinkage phase. | µm/min | Reflects the rate of dimer dissociation following GTP-cap loss, influenced by severing enzymes, depolymerases, and destabilizing agents. |
| Catastrophe Frequency | The probability of transitioning from growth or pause to shrinkage per unit time. | events/min | Measures the intrinsic stability of the GTP-cap; increased by destabilizing factors (e.g., stathmin, kinesin-13s). |
| Rescue Frequency | The probability of transitioning from shrinkage back to growth or pause per unit time. | events/min | Measures the ability to re-establish a stabilizing GTP-cap; influenced by +TIP complexes and specific cellular conditions. |
| Lifetime/Dynamicity | The total tubulin turnover, often calculated as (Growth Rate × Time Growing) + |Shrinkage Rate × Time Shrinking| per microtubule. | µm/min | A composite measure of overall microtubule turnover activity. |
Table 2: Example Quantitative Data from Recent TIRF Studies (2023-2024)
| Experimental Condition | Growth Rate (µm/min) | Shrinkage Rate (µm/min) | Catastrophe Freq (min⁻¹) | Rescue Freq (min⁻¹) | Reference Note |
|---|---|---|---|---|---|
| Control (10 µM tubulin) | 1.52 ± 0.21 | 2.98 ± 0.45 | 0.045 ± 0.008 | 0.12 ± 0.03 | Standard in vitro TIRF assay baseline. |
| +40 nM Kinesin-13 (MCAK) | 1.48 ± 0.18 | 4.21 ± 0.67 | 0.112 ± 0.015 | 0.09 ± 0.02 | Increased catastrophe & shrinkage, hallmarks of depolymerase activity. |
| +200 nM Taxol | 1.21 ± 0.15 | 1.05 ± 0.32 | 0.018 ± 0.005 | 0.25 ± 0.04 | Suppressed rates, reduced catastrophe, increased rescue (stabilizing phenotype). |
| +100 pM EB3 (GFP) | 1.75 ± 0.24 | 2.87 ± 0.41 | 0.038 ± 0.007 | 0.14 ± 0.03 | +TIP complex typically enhances growth and modestly suppresses catastrophe. |
Experimental Protocols
Protocol: TIRF Microscopy Assay for Microtubule Dynamics
Title: In Vitro Reconstitution of Microtubule Dynamics for TIRF Imaging and Kymograph Analysis.
Objective: To visualize and quantify the dynamic instability of individual microtubules in real-time using TIRF microscopy.
Materials: See "The Scientist's Toolkit" below.
Procedure:
- Flow Chamber Preparation: Create a passivated flow chamber by attaching a silanized coverslip to a glass slide using double-sided tape. Sequentially flow through:
- Poly-L-lysine-PEG-biotin (0.5 mg/mL, wait 5 min).
- Blocking buffer (1% Pluronic F-127 in BRB80, wait 10 min).
- NeutrAvidin (0.5 mg/mL in BRB80, wait 5 min).
- Biotinylated, GMPCPP-stabilized microtubule seeds (diluted in BRB80, wait 10 min).
- Wash with 3 chamber volumes of BRB80.
Reaction Mix Assembly: Prepare imaging mix on ice: BRB80, 1 mM GTP, oxygen scavenging system (0.2 mg/mL glucose oxidase, 0.035 mg/mL catalase, 25 mM glucose), 0.5% β-mercaptoethanol, 10-20 µM unlabeled tubulin, and a low concentration (50-100 nM) of fluorescently labeled tubulin (e.g., HiLyte 647). Include experimental factors (proteins, drugs) as required.
Initiation of Dynamics: Flow the imaging mix into the chamber. Immediately mount the chamber on a TIRF microscope stage pre-warmed to 35°C.
Image Acquisition: Using a 100x or 60x TIRF objective, acquire images of the Cy5/647 channel (for microtubules) every 3-5 seconds for 20-30 minutes. Use low laser power to minimize photodamage.
Kymograph Generation: Use Fiji/ImageJ. Draw a line along the axis of a selected microtubule. Generate a kymograph using the "Reslice" or "Multi Kymograph" function. The x-axis represents time, and the y-axis represents position along the microtubule.
Quantitative Tracing & Analysis: Manually track the microtubule plus-end position over time from the kymograph using a tool like KymographDirect or KymoButler. Export time and position data for statistical analysis in a dedicated software (e.g., IGOR Pro, Prism) or custom Python/R scripts to calculate the parameters in Table 1.
Protocol: Calculation of Dynamic Instability Parameters
Title: Computational Analysis of Microtubule End Tracking Data.
Objective: To derive growth/shrinkage rates and transition frequencies from time-position data of microtubule ends.
Input: A spreadsheet with columns: Microtubule_ID, Time (min), End_Position (µm).
Procedure:
- Phase Classification: For each time interval (∆t), calculate the instantaneous velocity:
v = ∆Position / ∆Time. Define a velocity threshold (e.g., ±0.1 µm/min). Phases are:- Growth:
v > +threshold - Shrinkage:
v < -threshold - Pause/Atenuated:
-threshold <= v <= +threshold
- Growth:
Rate Calculation: For each continuous growth (or shrinkage) event, perform a linear regression of position vs. time. The slope is the growth (or shrinkage) rate for that event. Average rates across all events and microtubules per condition.
Catastrophe Frequency: For each microtubule, count the number of transitions from Growth or Pause to Shrinkage. Sum the total time spent in growth and pause phases. Catastrophe frequency =
(Total # of catastrophes) / (Total time in Growth + Pause).Rescue Frequency: For each microtubule, count the number of transitions from Shrinkage to Growth or Pause. Sum the total time spent in shrinkage. Rescue frequency =
(Total # of rescues) / (Total time in Shrinkage).Lifetime Analysis: Calculate the total time from nucleation/seed emergence to complete depolymerization or end of movie. Analyze survival distributions using Kaplan-Meier plots for conditions where microtubules undergo complete turnover.
Visualization Diagrams
TIRF MT Dynamics Assay Workflow
From Kymograph to Quantitative Parameters
The Scientist's Toolkit
Table 3: Key Research Reagent Solutions for TIRF Microtubule Dynamics Assays
| Reagent/Material | Function & Specification | Key Consideration |
|---|---|---|
| Purified Tubulin | Core building block. >99% pure, from bovine/porcine brain or recombinant. Labeled derivatives (Cy2, TAMRA, HiLyte647) are essential for imaging. | Aliquoting and flash-freezing in liquid N₂ preserves polymerization competence. Avoid repeated freeze-thaw cycles. |
| GMPCPP Microtubule Seeds | Biotinylated, non-hydrolyzable GTP analog (GMPCPP) stabilizes short microtubules. These seeds nucleate dynamic growth from their plus ends. | Critical for controlling nucleation site number and orientation in the TIRF field. |
| Oxygen Scavenging System | Typically glucose oxidase, catalase, and glucose. Reduces photobleaching and radical-induced damage during prolonged imaging. | Must be prepared fresh or from single-use aliquots for maximum efficacy. |
| BRB80 Buffer | Standard microtubule physiological buffer (80 mM PIPES, 1 mM MgCl₂, 1 mM EGTA, pH 6.8 with KOH). Provides optimal ionic conditions for tubulin polymerization. | pH is critical; small deviations can significantly alter dynamics. |
| TIRF Microscope | Microscope with through-objective TIRF illumination, EM-CCD or sCMOS camera, 60x/100x high-NA TIRF objective, and precise temperature control (35°C). | Laser power must be minimized to prevent fluorophore photobleaching and protein photodamage. |
| Analysis Software (Fiji, KymoButler) | Fiji/ImageJ for kymograph generation. KymoButler or KymographDirect for automated plus-end tracking. Custom scripts (Python/R) for final parameter calculation. | Manual verification of automated tracking is mandatory to correct for errors. |
Troubleshooting Your TIRF Microtubule Assay: Solving Common Issues and Enhancing Data Quality
Within a broader thesis investigating microtubule dynamics using TIRF microscopy for drug discovery applications, achieving a high signal-to-noise ratio (SNR) is paramount. Poor SNR obscures the precise visualization of single microtubule filaments and the binding kinetics of associated proteins or drug candidates. This application note details three integrated solutions—probe optimization, camera parameter adjustment, and precise TIRF angle calibration—to maximize SNR, thereby enhancing the quantification of dynamic parameters such as growth speed, catastrophe frequency, and drug-induced stabilization.
Probe Optimization for Microtubule Labeling
The choice and application of fluorescent probes directly impact the fundamental signal strength and background noise.
Key Considerations
- Brightness & Photostability: Quantum yield and resistance to photobleaching under intense evanescent field illumination.
- Labeling Density: Sparse labeling for single-molecule tracking vs. uniform labeling for filament continuity.
- Conjugation Chemistry: Site-specific labeling to preserve protein function.
Quantitative Comparison of Common Microtubule Probes
The following table summarizes critical parameters for probes used in in vitro TIRF assays.
Table 1: Characteristics of Fluorescent Probes for Microtubule TIRF Assays
| Probe Name | Target | Excitation/Emission (nm) | Relative Brightness | Relative Photostability | Common Application in Assay |
|---|---|---|---|---|---|
| ATTO 488-Tubulin | Tubulin dimer | 501/523 | High | Very High | High-resolution dynamics, single-filament imaging |
| Alexa Fluor 568-Tubulin | Tubulin dimer | 578/603 | Very High | High | Standard dynamics assays, good for multiplexing |
| HiLyte Fluor 647-Tubulin | Tubulin dimer | 650/668 | High | Medium | Low background channel, ideal for TIRF |
| SIR-Tubulin | Tubulin dimer | 652/674 | Medium | Extreme | Long-term timelapse, super-resolution |
| GFP- or mCherry- MAP | Microtubule Associated Protein (MAP) | 488/509 or 587/610 | Variable | Variable | Visualization of MAP binding kinetics |
Protocol: Labeling Tubulin with ATTO 488 for TIRF Imaging
Materials: Unlabeled porcine brain tubulin, ATTO 488 NHS ester, labeling buffer (80 mM PIPES, 1 mM MgCl2, 1 mM EGTA, pH 6.9 with KOH), spin columns, BRB80 buffer.
- Prepare Tubulin: Desalt tubulin into labeling buffer (without glycerol) to a concentration of 5-10 mg/mL.
- Conjugate Dye: Dissolve ATTO 488 NHS ester in anhydrous DMSO. Add dye to tubulin at a 8:1 molar ratio (dye:tubulin). Mix gently.
- Incubate: React on ice for 2 hours in the dark.
- Purify: Remove free dye using a size-exclusion spin column equilibrated with BRB80 buffer + 1 mM DTT.
- Characterize: Determine degree of labeling (DOL, aim for 0.8-1.2) spectrophotometrically. Aliquot, snap-freeze, and store at -80°C.
- Polymerize for Assay: Mix labeled tubulin with unlabeled tubulin (typical ratio: 1:10 to 1:20) in BRB80 buffer with 1 mM GTP at 37°C for 20-30 minutes prior to imaging chamber preparation.
Camera Settings for EMCCD/sCMOS Cameras
Optimal camera configuration balances signal collection with noise suppression.
Parameter Optimization Guide
Table 2: Camera Parameter Optimization for Microtubule TIRF Imaging
| Parameter | Effect on Signal | Effect on Noise | Recommended Setting (EMCCD) | Recommended Setting (sCMOS) |
|---|---|---|---|---|
| EM Gain / Analog Gain | Amplifies signal post-readout | Amplifies all noise, especially clock-induced charge (CIC) | Set as high as needed (200-300x) for faint signals, lower for bright signals | Not applicable. Use appropriate analog gain setting (e.g., 12-bit high gain mode). |
| Exposure Time | Linear increase in signal | Increases dark current and photobleaching risk | 50-200 ms (balance temporal resolution and SNR) | 20-100 ms (leverage higher frame rates) |
| Readout Speed | Minimal direct effect | Higher speed increases read noise, lower speed reduces it | Use slower speed for maximal SNR unless high framerate is critical | Use the recommended pixel readout rate for the desired dynamic range. |
| Cooling Temperature | No direct effect | Drastically reduces dark current noise | -70°C to -80°C | -10°C to -30°C (active cooling) |
| Binning | Increases effective signal per pixel | Reduces spatial resolution; reduces read noise per binned pixel | 1x1 (to preserve microtubule structure) | 1x1 (to preserve microtubule structure) |
Protocol: Camera Calibration for Quantitative TIRF
- Dark Current Measurement: Acquire 100 frames with the lens cap on, using your standard exposure time and cooling. Calculate the mean pixel value per frame. This is your average dark current offset.
- Read Noise Estimation: Acquire 100 dark frames at the shortest possible exposure. Calculate the standard deviation of a uniform region in the difference between two consecutive frames. This approximates read noise.
- Signal Validation: Image a calibration slide (e.g., fluorescent nanospheres). Ensure the measured intensity is linear with exposure time and gain settings.
- Set EM Gain: For EMCCD, start with EM gain at 1x. Image a dim microtubule sample. Incrementally increase EM gain until the feature is clear above background, but do not exceed the point where noise granules become prominent.
TIRF Angle Adjustment and Penetration Depth Control
The evanescent field penetration depth ((d)) is critically dependent on the incident angle ((\theta)) and dictates axial resolution and background rejection. [ d = \frac{\lambda0}{4\pi} \left[ nc^2 \sin^2 \theta - nm^2 \right]^{-1/2} ] Where (\lambda0) is the vacuum wavelength, (nc) is the coverglass/cell index, (nm) is the sample medium index, and (\theta) is the incident angle.
Protocol: Aligning and Adjusting the TIRF Angle
Objective: To find the critical angle ((\theta_c)) and set the working angle for optimal SNR.
- Prepare Sample Chamber: Use a chamber with a solution of a dilute, uniform fluorophore (e.g., Alexa Fluor 488 at ~1 nM in buffer).
- Initial Alignment: With the laser at low power, observe the epifluorescence pattern. The beam should be centered and collimated.
- Find Critical Angle: Gradually increase the incident angle via the laser coupling mechanism. Observe the emission field. (\theta_c) is reached when the widefield illumination suddenly collapses to a thin, intense line at the interface. Note the position.
- Set TIRF Angle: Increase the angle 1-5° beyond (\theta_c). The illumination should become a very thin, dim evanescent field. On a camera, the uniform fluorescence will now appear as a very thin optical section.
- Validate on Microtubules: Image polymerized microtubules immobilized on the coverslip. Optimize the angle to maximize filament contrast while minimizing background from unbound tubulin in solution. A penetration depth of 70-150 nm is typical for microtubule assays.
The Scientist's Toolkit: Research Reagent Solutions
Table 3: Essential Materials for TIRF-based Microtubule Dynamics Assays
| Item | Function & Rationale |
|---|---|
| High-Purity Tubulin (e.g., Cytoskeleton Inc. Cat. #T240) | Essential polymerization component. Low batch-to-batch variability ensures reproducible dynamic parameters. |
| BRB80 Buffer (80 mM PIPES, 1 mM MgCl2, 1 mM EGTA, pH 6.9) | Standard microtubule polymerization and stabilization buffer. Must be filtered (0.22 µm) for TIRF to reduce scattering particles. |
| Anti-Fade Systems (e.g., Oxyrase, PCA/PCD, Trolox) | Enzymatic or chemical oxygen scavengers to reduce photobleaching and phototoxicity, extending imaging time. |
| Passivation Agents (Pluronic F-127, Casein) | Coats flow chambers to prevent nonspecific sticking of tubulin and proteins, drastically reducing background noise. |
| Polymerization Promoters (GTP, GMPCPP) | GTP for dynamic assays; non-hydrolyzable GMPCPP to create stable, seeded microtubules for plus-end tracking assays. |
| High-Performance Coverslips (#1.5H, 170 µm ± 5 µm) | Precision thickness is non-negotiable for TIRF objective correction collars and consistent evanescent field generation. |
| Immersion Oil (with matched refractive index, e.g., n=1.518) | Critical for maximizing numerical aperture and light collection; mismatch introduces spherical aberration and signal loss. |
Experimental Workflow and Signal Optimization Pathway
TIRF SNR Optimization Decision Pathway
Impact of Incident Angle on Key Imaging Parameters
In Total Internal Reflection Fluorescence (TIRF) microscopy assays for microtubule dynamics, prolonged excitation of fluorophores (e.g., GFP-tagged tubulin, rhodamine-labeled taxol) induces photobleaching and phototoxicity. Photobleaching diminishes signal intensity, compromising data quality for kinetic measurements of growth/shrinkage rates. Phototoxicity generates reactive oxygen species (ROS), damaging live samples and altering microtubule dynamics, leading to artifactual results. This is critical in drug development screening where subtle perturbations from compounds must be distinguished from imaging artifacts.
Mechanisms and Quantitative Impact
Table 1: Quantitative Impact of Photodamage in TIRF Microtubule Assays
| Parameter | Typical Value (No Mitigation) | Value with Mitigation | Measurement Context |
|---|---|---|---|
| Fluorophore Half-life (GFP-α-tubulin) | 5-15 seconds | 60-180 seconds | Continuous TIRF, 488nm, 1-5 mW/µm² |
| Microtubule Growth Rate Artifact | Increases 15-25% | <5% change from control | Due to ROS-induced catastrophe suppression |
| Cell Viability Post-Imaging (5 min) | ~60% | >90% | Mammalian cells (e.g., U2OS, RPE-1) |
| Single-Molecule Event Duration | Underestimated by ~40% | Underestimated by <10% | EB3-GFP comet tracking |
Mitigation Strategies: Application Notes & Protocols
Oxygen Scavenging Systems
These systems enzymatically remove dissolved oxygen, a triplet-state quencher and ROS source.
Protocol: GLOX System for Live-Cell TIRF Imaging Objective: Prepare an imaging medium to significantly reduce photobleaching. Materials:
- Glucose Oxidase from Aspergillus niger (Sigma G0543)
- Catalase from bovine liver (Sigma C9322)
- 40% (w/v) Glucose solution (sterile)
- Phenol Red-free imaging medium (e.g., Leibovitz's L-15)
- 0.22 µm syringe filter
Procedure:
- Prepare a 100x GLOX stock solution in 1.5 mL tube:
- 70 µL Glucose Oxidase stock (20 mg/mL in PBS)
- 10 µL Catalase stock (50 mg/mL in PBS)
- 20 µL PBS. Vortex gently. Centrifuge briefly. Store on ice (use within 8 hrs).
- For 2 mL of final imaging medium, combine:
- 1.94 mL Phenol Red-free medium
- 20 µL of 100x GLOX stock (final: [GlOx] ~0.7 mg/mL, [Cat] ~0.25 mg/mL)
- 40 µL of 40% Glucose solution (final: ~0.8% w/v).
- Mix gently by inversion. Filter sterilize if required for live cells.
- Equilibrate cells in this medium for 5 minutes at 37°C prior to imaging. Note: For sealed chambers, this system is effective for ~30-45 minutes. Optimize enzyme concentrations to avoid acidification (pH drop).
Reducing/Antioxidant Agents
Chemical additives that directly quench triplet states and scavenge ROS.
Protocol: Trolox and Ascorbic Acid Supplementation Objective: Add stable reducing agents to imaging buffer for in vitro microtubule dynamics assays. Materials:
- (+)-6-Hydroxy-2,5,7,8-tetramethylchromane-2-carboxylic acid (Trolox) (Sigma 238813)
- L-Ascorbic acid (Sigma A92902)
- DMSO, NaOH (1M)
- BRB80 Tubulin Buffer (80 mM PIPES, 1 mM MgCl2, 1 mM EGTA, pH 6.8 with KOH)
Procedure:
- Prepare 100 mM Trolox stock: Dissolve 25.0 mg Trolox in 500 µL DMSO. Vortex until clear.
- Prepare 1 M Ascorbic Acid stock: Dissolve 17.6 mg in 100 µL dH2O. Adjust pH to ~7.0 with NaOH. Use immediately.
- For 1 mL of in vitro TIRF imaging buffer (e.g., for dynamic microtubules + GFP-MAPs), add:
- 10 µL Trolox stock (Final: 1 mM)
- 2 µL Ascorbic Acid stock (Final: 2 mM)
- 988 µL BRB80 buffer with necessary components (tubulin, GTP, oxygen scavengers).
- Mix thoroughly, protect from light, and use within 1 hour. Note: For live cells, Trolox can be used at 0.5-1 mM, but test for biological effects on microtubule dynamics.
Low-Laser Intensity & Smart Acquisition Strategies
Minimizing photon flux is the most direct method to reduce damage.
Protocol: Adaptive Exposure for Microtubule Tip Tracking Objective: Implement a microscope acquisition protocol that minimizes dose while preserving data fidelity. Software Requirements: Micro-manager, MetaMorph, or similar with acquisition sequencing. Procedure:
- Determine Minimum Laser Power: Using your TIRF system, image a representative sample (GFP-tubulin). Start at 0.1% laser power (488nm). Incrementally increase until EB3 comets or microtubule filaments are discernible with a SNR > 3. This is your P_min.
- Set Acquisition Parameters:
- Exposure Time: 50-100 ms (balances temporal resolution and intensity).
- Laser Power: Use P_min (typically 0.5-2% TIRF laser output).
- EMCCD/Gain: Set to a level where maximum pixel intensity is ~70% of saturation.
- Frame Interval: 2-5 seconds for dynamics (prevents oversampling).
- Implement "Find-Focus" Pause: Program a 30-second pause in acquisition every 10 frames. During this pause, shutter closes, allowing cellular recovery.
- Use Selective Illumination: If tracking specific areas of interest (e.g., single cell), mask the illumination to that region only.
Integrated Workflow for a Robust Microtubule Dynamics Assay
Diagram Title: Integrated Mitigation Workflow for TIRF Assays
The Scientist's Toolkit: Research Reagent Solutions
Table 2: Essential Reagents for Mitigating Photodamage in Microtubule TIRF
| Reagent / Material | Supplier (Example) | Function in Assay | Key Consideration |
|---|---|---|---|
| Glucose Oxidase | Sigma-Aldrich, G0543 | Enzyme in GLOX system; consumes O₂ to reduce ROS generation. | Activity varies by lot; high concentrations can acidify medium. |
| Catalase | Sigma-Aldrich, C9322 | Enzyme in GLOX; decomposes H₂O₂ produced by glucose oxidase. | Prevents buildup of toxic H₂O₂. Bovine liver source is standard. |
| Trolox | Sigma-Aldrich, 238813 | Water-soluble vitamin E analog; quenches triplet states & radicals. | Can affect some biological processes. Test in control experiments. |
| Ascorbic Acid (Vitamin C) | Sigma-Aldrich, A92902 | Antioxidant; reduces ROS directly in aqueous solution. | Unstable, oxidizes quickly. Prepare fresh, adjust pH to neutral. |
| Pyranose Oxidase + Catalase (PCO) | Toyobo, etc. | Alternative O₂ scavenger; broader pH stability than GLOX. | Often preferred for in vitro single-molecule assays. |
| Cysteamine (MEA) | Sigma-Aldrich, 30070 | Thiol-based reducing agent; popular for STORM but used in TIRF. | Has odor; can be toxic to cells at higher mM concentrations. |
| Phenol Red-free Medium | Thermo Fisher, 21083027 | Imaging medium; removes autofluorescence from phenol red. | Essential for low-light imaging to maximize signal-to-noise. |
| Sealed Imaging Chamber | Grace Bio-Labs, SecureSeal | Creates sealed environment for O₂ scavengers to work effectively. | Prevents O₂ diffusion back into the sample during long acquisitions. |
| Neutral Density Filters | Chroma, Thorlabs | Physically reduces laser intensity entering the microscope. | Crucial for achieving repeatable, low-dose illumination (P_min). |
Final Integrated Protocol:
- Prepare Imaging Chamber: Seed cells expressing GFP-α-tubulin on high-quality glass-bottom dishes.
- Prepare Combined Mitigation Buffer: To 10 mL of pre-warmed, Phenol Red-free medium, add:
- 100 µL of 100x GLOX stock.
- 200 µL of 40% Glucose.
- 50 µL of 100 mM Trolox stock (from DMSO, final 0.5 mM).
- Mix and filter (0.22 µm).
- Mount Sample: Replace culture medium with 2 mL of mitigation buffer. Seal chamber if possible.
- Microscope Setup: On TIRF system, align 488nm laser, set TIRF angle.
- Set Acquisition: Use minimal laser power (P_min), 100 ms exposure, 3-5 sec interval, 500 frames total. Activate hardware focus stabilization.
- Acquire & Analyze: Run acquisition. Analyze microtubule dynamics (e.g., using plusTipTracker) and report fluorophore half-life from non-bleach corrected data.
This protocol is framed within a broader thesis investigating the regulation of microtubule dynamics in live cells using Total Internal Reflection Fluorescence (TIRF) microscopy. A core challenge in this research is maintaining primary cell health and achieving optimal, physiologically relevant adhesion of cytoskeletal structures to the coverslip substrate. Poor adhesion leads to aberrant microtubule behavior, increased background fluorescence, and rapid phototoxicity, confounding quantitative analysis of dynamics. These application notes detail standardized protocols for coverslip functionalization and imaging media formulation to ensure reproducible cell health and superior signal-to-noise ratio for TIRF-based assays.
Table 1: Comparison of Coverslip Coating Methods for Microtubule TIRF Imaging
| Coating Method | Typical Concentration/ Dilution | Incubation Time & Temp | Primary Cell Type Validated | Key Outcome for Microtubule Assays | Reported Adhesion Strength (Relative) |
|---|---|---|---|---|---|
| Poly-L-Lysine | 0.01% (w/v) in water | 1 hr, RT | Rat hippocampal neurons | Adequate for neuron plating; moderate background. | Medium |
| Poly-L-Lysine/PLL-g-PEG | 0.1 mg/mL PLL, 1:3 PLL-g-PEG ratio | 1 hr, 37°C | HeLa, RPE-1 | Reduces non-specific binding; improves single-molecule imaging. | Medium-High |
| Functionalized Silane (APTES) | 2% (v/v) in acetone | 10 min, RT, then bake | U2OS, COS-7 | High adhesion; can be too harsh for sensitive cells. | Very High |
| ECM-Based (Matrigel) | 1:50 to 1:100 dilution in DMEM | 1 hr, 37°C | iPSC-derived cardiomyocytes | Provides physiological ligands; excellent for cell health. | High |
| PLL-PEG-Biotin + Streptavidin | 0.1 mg/mL each, sequential | 30 min each, RT | In vitro reconstitution | Enables precise attachment of biotinylated tubulin/structures. | Tunable (Very High) |
Table 2: Imaging Media Components & Impact on Cell Viability (TIRF Illumination)
| Component | Typical Concentration | Purpose in TIRF Assay | Effect on Microtubule Dynamics (Reported) | Max Recommended Imaging Duration (at 37°C) |
|---|---|---|---|---|
| HEPES Buffer | 10-25 mM | Maintains pH outside CO₂ incubator. | Negligible | 1-2 hours |
| Oxyrase / Glucose Oxidase-Catalase | 2-5 U/mL Oxyrase | Scavenges dissolved oxygen to reduce phototoxicity & fluorophore bleaching. | Preserves plus-end growth rates. | >60 minutes (extended) |
| Trolox / Ascorbic Acid | 1-2 mM | Quenches free radicals, further reduces photobleaching. | Stabilizes dynamic instability parameters. | >60 minutes (extended) |
| d-Glucose | 4.5-5.5 g/L | Energy substrate for glycolysis in absence of pyruvate. | Essential for maintaining cellular ATP. | N/A (essential component) |
| Phenol Red-Free | N/A | Eliminates background fluorescence in red channels. | No direct effect. | N/A |
Section 2: Detailed Experimental Protocols
Protocol 1: High-Fidelity PLL-g-PEG Coating for Low-Background TIRF Objective: Create a non-fouling, consistent substrate that promotes cell adhesion while minimizing non-specific protein absorption.
- Materials: #1.5 high-precision coverslips, 1 M NaOH, 70% ethanol, Poly-L-Lysine-grafted-PEG (PLL-g-PEG), sterile PBS.
- Cleaning: Sonicate coverslips in 1 M NaOH for 20 minutes. Rinse 5x with distilled water. Sonicate in 70% ethanol for 20 minutes. Air-dry in a laminar flow hood.
- Plasma Treatment (Optional but recommended): Treat dried coverslips with air plasma (Harrick Plasma) for 5 minutes to generate uniform hydroxyl groups.
- Coating: Prepare a 0.1 mg/mL solution of PLL-g-PEG in sterile PBS. Pipette 100 µL onto a clean Parafilm surface. Place a coverslip (cleaned side down) onto the droplet, ensuring no bubbles. Incubate for 1 hour at 37°C or room temperature.
- Rinsing & Storage: Carefully lift coverslip, rinse gently by dipping 3x in sterile PBS, and then immerse in fresh PBS. Use immediately for cell plating or store at 4°C for up to 1 week.
Protocol 2: Oxygen-Scavenging Imaging Media for Live-Cell Microtubule TIRF Objective: Formulate a medium that maintains cell physiology and dramatically extends the window of viable imaging under intense TIRF illumination.
- Base Medium Preparation: To 50 mL of FluoroBrite DMEM (phenol red-free), add 0.9 g D-Glucose, 1.25 mL of 1 M HEPES buffer (pH 7.4), and 0.5 mL of 200 mM L-Glutamine. Filter sterilize (0.22 µm).
- Additive Stocks: Prepare fresh for each experiment.
- Trolox Stock: 10 mM in water, pH adjusted to ~7.4 with NaOH.
- Ascorbic Acid Stock: 100 mM in water, fresh.
- Oxyrase: Use directly from commercial vial (EC-005).
- Final Assembly: For 5 mL of imaging medium, combine 4.95 mL of Base Medium with 50 µL of Trolox stock (final 100 µM), 25 µL of Ascorbic Acid stock (final 0.5 mM), and 100 µL of Oxyrase (final ~2-5 U/mL). Warm to 37°C before use. Note: Do not add serum immediately, as it can inhibit Oxyrase activity. Cells can be imaged in this serum-free medium for 60+ minutes.
Section 3: Visualized Workflows & Pathways
Diagram 1: Workflow for optimal substrate and media preparation.
Diagram 2: How imaging media mitigates TIRF-induced phototoxicity.
Section 4: The Scientist's Toolkit: Essential Research Reagents
Table 3: Key Reagent Solutions for Microtubule TIRF Assays
| Reagent / Material | Supplier Examples | Function in Protocol | Critical Specification |
|---|---|---|---|
| #1.5 High-Precision Coverslips | Warner Instruments, MatTek | Imaging substrate for TIRF microscopy. | Thickness tolerance: 170 µm ± 5 µm. |
| Poly-L-Lysine-g-PEG (PLL-g-PEG) | SuSoS AG, Sigma-Aldrich | Creates a passivating, non-fouling monolayer that permits specific cell adhesion. | Grafting ratio (PEG chains per PLL backbone). |
| FluoroBrite DMEM | Thermo Fisher Scientific | Low-autofluorescence, phenol red-free base imaging medium. | Must be supplemented as detailed. |
| Oxyrase EC-005 | Oxyrase, Inc. | Enzyme system that scavenges dissolved oxygen, drastically reducing photobleaching & toxicity. | Batch activity can vary; store at -20°C. |
| Trolox (6-hydroxy-2,5,7,8-tetramethylchroman-2-carboxylic acid) | Sigma-Aldrich | Water-soluble vitamin E analog that quenches free radicals. | Requires pH adjustment to 7.4 for cell culture use. |
| HEPES Buffer (1M, pH 7.4) | Thermo Fisher Scientific | Biological buffer for maintaining physiological pH outside a CO₂ environment. | Sterile, cell culture tested. |
| APTES ((3-Aminopropyl)triethoxysilane) | Sigma-Aldrich | Silane coupling agent for covalent functionalization of glass surfaces. | >98% purity; use fresh or under inert atmosphere. |
Within a thesis focused on TIRF microscopy-based microtubule dynamics assays, the ability to resolve the precise spatial and temporal relationships between microtubule ends, their associated proteins, and regulatory factors is paramount. Multi-color Total Internal Reflection Fluorescence (TIRF) microscopy is the foundational technique for this co-localization analysis. It provides the necessary signal-to-noise ratio, axial resolution (~100 nm), and speed to visualize dynamic events at the single-molecule level in vitro or in live cells.
This protocol details the optimization for simultaneous imaging of three channels: microtubules (labeled in red), a core plus-end tracking protein (+TIP) such as EB1 or EB3 (labeled in green), and a third regulatory protein of interest (labeled in far-red, e.g., a kinase, phosphatase, or drug target). This triad allows for the direct interrogation of whether a regulatory protein co-localizes with the +TIP complex, follows it dynamically, and how perturbations (e.g., drug treatment) affect these relationships and underlying microtubule dynamics parameters.
Table 1: Key Quantitative Parameters for Multi-color TIRF Co-localization Assays
| Parameter | Target Value | Purpose & Rationale |
|---|---|---|
| Frame Rate | 0.5 - 5 Hz | Balances temporal resolution for tracking (+TIP comets move ~0.2-0.3 µm/s) with minimal photobleaching. |
| Laser Illumination Power | 0.5 - 5 mW (at fiber output) | Must be minimized to reduce photodamage while maintaining sufficient signal for single-molecule detection. |
| Axial Penetration Depth (d) | 70 - 150 nm | Controlled by the laser incident angle. Shallower d increases SNR but may miss proteins slightly off the coverslip. |
| Chromatic Shift Correction | < 1 pixel (e.g., < 160 nm) | Critical for accurate co-localization. Must be measured and corrected using multicolor fiducial markers (e.g., TetraSpeck beads). |
| Co-localization Threshold (Manders' Overlap Coefficients) | M1 > 0.5, M2 > 0.5 | Quantitative measure of signal overlap. Values >0.5 suggest significant co-localization above random chance. |
| EB Comet Tracking Speed | ~0.25 ± 0.1 µm/s | A key validation metric for healthy, dynamic microtubules in the assay. |
Detailed Experimental Protocols
Protocol 2.1: In Vitro Reconstitution Assay for +TIP/Regulator Co-localization
Objective: To observe direct interaction of purified proteins on dynamically growing microtubules.
Key Reagents & Materials:
- Purified tubulin (≥99% pure), labeled with ATTO 550 or HiLyte 647.
- Purified recombinant +TIP protein (e.g., EB3-GFP or SNAP-tagged EB1, labeled with SNAP-Surface 549).
- Purified recombinant regulatory protein (e.g., a CLASP or kinase, labeled with Alexa Fluor 647 or SNAP-tagged and labeled with SNAP-Surface 647).
- BRB80 buffer (80 mM PIPES, 1 mM EGTA, 1 mM MgCl2, pH 6.8).
- Oxygen scavenging system (PCA/PCD: 0.2 mg/mL glucose oxidase, 0.035 mg/mL catalase, 4.5 mg/mL glucose).
- Trolox (2 mM) to reduce dye blinking/bleaching.
- GMPCPP-stabilized microtubule seeds.
- Flow chamber constructed from a silanized glass coverslip and a PEG-passivated slide.
Workflow:
- Chamber Preparation: Create a flow chamber. Passivate with 1% Pluronic F-127 in BRB80 for 10 min to prevent non-specific adsorption.
- Seed Attachment: Flow in GMPCPP-stabilized microtubule seeds (unlabeled) and incubate for 5 min. Wash with BRB80.
- Reaction Mix Assembly: Prepare growth mix containing:
- BRB80 buffer
- 1 mM GTP
- 12-15 µM tubulin (5-10% labeled)
- 50-100 nM EB3-GFP
- 50-200 nM regulatory protein (labeled)
- Oxygen scavenging system and Trolox.
- Imaging: Flow reaction mix into chamber. Immediately acquire TIRF images using 488 nm (EB3), 561 nm (microtubules), and 640 nm (regulator) lasers with EMCCD or sCMOS camera. Capture time series for 5-10 minutes at 2-second intervals.
Protocol 2.2: Live-Cell Multi-color TIRF for Endogenous Protein Co-localization
Objective: To study co-localization dynamics in a live cellular context.
Key Reagents & Materials:
- Cell line (e.g., U2OS, RPE-1).
- Transfection reagents or stable cell lines.
- Fluorescent tags: mEmerald/GFP for EB3, mScarlet/mCherry for tubulin (or SiR-tubulin live stain), and a far-red tag (mIFP, HaloTag-JF646, SNAP-tag-Cell 647) for the regulatory protein.
- Live-cell imaging medium (CO₂-independent, phenol red-free).
- Microtubule-stabilizing agent (e.g., 10 µM Taxol) or destabilizing agent (e.g., 100 nM Nocodazole) for perturbation controls.
Workflow:
- Cell Preparation: Seed cells on high-performance #1.5H coverslips 24-48h prior. Transfect or induce expression of fluorescently tagged constructs. For tubulin labeling, use 100 nM SiR-tubulin for 1 hour before imaging.
- Microscope Setup: Pre-warm stage and objective to 37°C. Use an objective heater collar. Align TIRF lasers for 488nm, 561nm, and 640nm excitation.
- Chromatic Shift Calibration: Image 0.1 µm TetraSpeck beads. Calculate and apply a transformation matrix to align all three channels.
- Acquisition: Find a cell with moderate expression. Set TIRF angle to achieve ~100 nm penetration. Acquire a 3-5 minute time-lapse at 2-5 second intervals with minimal laser power. Perform a drug perturbation experiment by adding compound after 2 minutes of baseline imaging.
- Analysis: Use FIJI/ImageJ with TrackMate (for EB comet tracking) and JACoP or ICY plugins for co-localization analysis. Generate kymographs from line ROIs along microtubules.
Signaling Pathway & Workflow Diagrams
Title: Multi-color TIRF Experimental Workflow
Title: +TIP Regulatory Network at Microtubule End
The Scientist's Toolkit: Research Reagent Solutions
Table 2: Essential Materials for Multi-color TIRF Co-localization Assays
| Item | Function & Rationale | Example Product/Catalog |
|---|---|---|
| High-Purity Tubulin | Core component for in vitro assays. Labeling consistency is critical for SNR. | Cytoskeleton, Inc. (T240) or in-house purification. |
| SNAP/HaloTag Ligands | Enables specific, covalent labeling of recombinant or cellular proteins with a choice of bright, photostable dyes. | New England Biolabs (SNAP-Surface dyes), Promega (HaloTag JF dyes). |
| Cell-Silicon Rhodamine (SiR) Tubulin | A superior live-cell microtubule stain with far-red emission, minimal toxicity, and high specificity. | Cytoskeleton, Inc. (CY-SC002) or Spirochrome. |
| Oxygen Scavenging System | Prolongs fluorophore longevity and reduces photodamage in in vitro assays by removing reactive oxygen species. | Commercially available as "Gloxy" or prepared from glucose oxidase/catalase. |
| TetraSpeck Fluorescent Microspheres | Essential for measuring and correcting chromatic aberration across all imaging channels. | Thermo Fisher Scientific (T7279). |
| PEGylated / Passivated Coverslips | Minimizes non-specific binding of proteins in in vitro assays, reducing background. | Schott Nexterion, or in-house silanization with mPEG-silane. |
| Immersion Oil (Low Autofluorescence) | Critical for maintaining TIRF illumination and signal collection efficiency. Must match refractive index. | Cargille Type DF or equivalent. |
Validating TIRF Data and Comparing Modalities: Ensuring Robust Results for Research and Screening
Application Notes
Within the thesis context of developing a robust TIRF microscopy assay for quantifying microtubule (MT) dynamics, orthogonal validation is paramount. The high spatiotemporal data from TIRF must be correlated with complementary techniques to confirm molecular identity, structural integrity, and biochemical activity. This document details protocols for correlating TIRF-based dynamic instability parameters with biochemical tubulin polymerization assays and negative stain electron microscopy (EM).
Table 1: Correlation of TIRF and Biochemical Assay Data for Compound X
| Parameter | TIRF Microscopy Assay Result | In Vitro Tubulin Polymerization Assay Result | Correlation Purpose |
|---|---|---|---|
| Polymerization Rate | 0.45 µm/min (±0.08) | Slope (A340/min): 0.12 (±0.02) | Validates dynamic growth phase measurements. |
| MT Nucleation Frequency | 12 events/field/5min (±3) | Lag Time: 180 sec (±25) | Confirms effects on initial tubulin oligomerization. |
| Catastrophe Frequency | 0.25 events/µm/min (±0.05) | Not directly measured. | Requires EM for structural validation of MT ends. |
| Drug IC50 (Inhibition of Growth) | 8.5 nM (±1.2) | 9.1 nM (±1.5) | Confirms biochemical potency correlates with cellular phenotype. |
Protocol 1: TIRF Microscopy Microtubule Dynamics Assay
- Objective: To quantify parameters of dynamic instability (growth rate, shrinkage rate, catastrophe frequency, rescue frequency) from individual microtubules in vitro.
- Key Reagents: HiLyte 647-labeled porcine brain tubulin, unlabeled tubulin, GMPCPP (nucleotide analog), BRB80 buffer (80 mM PIPES, 1 mM MgCl2, 1 mM EGTA, pH 6.8), oxygen scavenging system (glucose oxidase, catalase, β-mercaptoethanol), casein.
- Procedure:
- Flow Chamber Preparation: Create a double-sided tape flow chamber on a plasma-cleaned coverslip. Passivate with 1 mg/mL casein in BRB80 for 5 min.
- Microtubule Seed Anchoring: Introduce GMPCPP-stabilized, biotinylated MT seeds in BRB80, incubate 5 min. Flush with casein buffer to remove unbound seeds.
- Imaging Mix Preparation: Prepare tubulin mix (10-20 µM total tubulin, ~10% labeled) in BRB80 with 1 mM GTP, oxygen scavengers, and test compound/vehicle.
- Data Acquisition: Introduce imaging mix into the chamber. Image immediately on a TIRF system with a 640 nm laser, acquiring frames every 3-5 seconds for 10-20 minutes.
- Analysis: Track plus-end microtubule tips using software (e.g., FIESTA, TrackMate, plusTipTracker). Calculate dynamic instability parameters from life history plots.
Protocol 2: In Vitro Tubulin Polymerization Spectrophotometric Assay
- Objective: To biochemically validate compounds affecting microtubule mass formation over time.
- Key Reagents: Purified porcine brain tubulin (>99% pure), PEM buffer (100 mM PIPES, 1 mM MgCl2, 1 mM EGTA, pH 6.8), GTP, test compounds.
- Procedure:
- On ice, prepare a 96-well plate with 100 µL reactions containing 2 mg/mL (20 µM) tubulin, 1 mM GTP, and test compound in PEM buffer.
- Place the plate in a pre-warmed (37°C) plate reader. Monitor turbidity by measuring absorbance at 340 nm every 30 seconds for 60-90 minutes.
- Plot A340 vs. time. Determine the lag phase (nucleation), slope (elongation rate), and plateau (steady-state polymer mass).
- Compare polymerization kinetics and derived IC50 values with TIRF-derived growth rates (Table 1).
Protocol 3: Negative Stain Electron Microscopy of Microtubule Ends
- Objective: To structurally validate TIRF observations of catastrophe events or stabilized MT ends.
- Key Reagents: Polymerized MTs from Protocol 2, uranyl acetate (2%), glow-discharged carbon-coated EM grids, filter paper.
- Procedure:
- At a specified time point from the polymerization assay or TIRF reaction, apply 5 µL of sample to the EM grid. Incubate 1 min.
- Wick away liquid with filter paper. Immediately add 5 µL of negative stain (2% uranyl acetate). Incubate 30 seconds.
- Wick away stain and air dry the grid.
- Image using a transmission electron microscope at 80-100 kV.
- Analyze images for MT integrity, sheet structures at growing ends, or blunt/tapered ends during shrinkage, correlating structural states with TIRF dynamics phases.
Experimental Validation Workflow
Diagram 1: Workflow for orthogonal validation of TIRF data.
Pathway: Compound Effect on Microtubule Dynamics
Diagram 2: Multi-technique validation of a microtubule-stabilizing compound.
The Scientist's Toolkit: Research Reagent Solutions
| Item | Function in Validation Pipeline |
|---|---|
| HiLyte 647-labeled Tubulin | High-quantum yield fluorophore for sensitive, low-background TIRF imaging of dynamic microtubules. |
| GMPCPP | Non-hydrolyzable GTP analog used to form stable, short microtubule "seeds" to synchronize TIRF assays. |
| Oxygen Scavenging System (GlOx/Catalase) | Prolongs fluorophore activity and prevents photodamage during time-lapse TIRF imaging. |
| Casein | Passivating agent that coats surfaces to prevent non-specific tubulin adsorption in flow chambers. |
| >99% Pure Tubulin | Essential for both biochemical (turbidity) and structural (EM) assays to avoid artefactual polymerization. |
| Uranyl Acetate | Negative stain for EM; envelopes macromolecules, providing high-contrast visualization of MT structure. |
| Glow-Discharged EM Grids | Hydrophilic carbon film grids that ensure even sample adsorption for high-quality negative stain EM. |
Application Notes
The choice between Total Internal Reflection Fluorescence (TIRF) microscopy and Spinning Disk Confocal (SDC) microscopy is critical for accurate investigation of microtubule (MT) dynamics, a cornerstone of many cell biological and drug discovery studies. Within the context of a thesis on TIRF microscopy microtubule dynamics assays, understanding the fundamental optical and application differences is paramount for experimental design and data interpretation.
Core Principle & Illumination:
- TIRF Microscopy: Utilizes an evanescent field generated by total internal reflection at the coverslip-cell interface. This field decays exponentially, illuminating only a thin section (~70-200 nm) adjacent to the coverslip. It is exquisitely suited for imaging processes at or near the plasma membrane with exceptional signal-to-noise ratio (SNR) and minimal photobleaching of out-of-focus fluorophores.
- Spinning Disk Confocal: Uses a rotating disk of pinholes to scan multiple points simultaneously. It rejects out-of-focus light, allowing optical sectioning through thicker samples (typically ~500-700 nm per slice). It offers faster acquisition with lower phototoxicity compared to point-scanning confocals.
Primary Application in MT Dynamics:
| Feature | TIRF Microscopy | Spinning Disk Confocal |
|---|---|---|
| Optimal Sample | Cortical microtubules, adhesion complexes, membrane trafficking. | Microtubules throughout the cytoplasm, mitotic spindle in 3D, thicker cells/tissues. |
| Excitation Depth | ~70-200 nm (evanescent field). | ~500-700 nm (optical slice). |
| Out-of-Focus Light | Virtually eliminated. | Rejected by pinholes. |
| Photobleaching/ Toxicity | Low (only thin section illuminated). | Moderate (entire optical slice illuminated). |
| Temporal Resolution | Very High (widefield camera-based). | High (camera-based, limited by pinhole spacing). |
| Quantitative Strength | Precise single-molecule counting, kinetics at cortex. | 3D tracking, dynamics in bulk cytoplasm. |
| Key Limitation | Restricted to cell-substrate interface. | Lower axial resolution & SNR vs. TIRF for cortical events. |
Conclusion: For a thesis focused on cortical microtubule dynamics (e.g., MT interaction with the cell cortex, capture at adhesion sites, or plus-end dynamics at the membrane), TIRF is the indispensable tool. For studying global microtubule network dynamics, polymerization in the bulk cytoplasm, or in samples thicker than a few microns, Spinning Disk Confocal is the appropriate choice.
Experimental Protocols
Protocol 1: TIRF Microscopy Assay for Cortical Microtubule Plus-End Tracking
Objective: Image and quantify the dynamics of EB3-GFP (a plus-end tracking protein) on cortical microtubules.
Materials: See "The Scientist's Toolkit" below. Procedure:
- Cell Preparation: Plate immortalized mammalian cells (e.g., RPE-1, U2OS) on high-precision #1.5H glass-bottom dishes 24-48 hours before imaging.
- Transfection: Transfect cells with an EB3-GFP plasmid using a lipid-based method appropriate for your cell line 18-24 hours before imaging.
- Media Exchange: Prior to imaging, replace growth media with pre-warmed, phenol-red-free live-cell imaging media supplemented with 10% FBS and, optionally, a mitochondrial inhibitor (e.g., 1µM Oxalic Acid) to reduce phototoxicity.
- Microscope Setup:
- Mount dish on a pre-warmed (37°C) stage with 5% CO₂ control.
- Use a 100x or 60x high-NA (≥1.45) TIRF objective.
- Align the TIRF laser (488 nm for GFP) to achieve critical angle and a consistent evanescent field depth (~100 nm). Calibrate using fluorescent beads.
- Set up a sensitive EM-CCD or sCMOS camera.
- Image Acquisition: Find a well-spread, moderately expressing cell. Acquire time-lapse movies at 1-2 second intervals for 2-5 minutes. Use minimal laser power to reduce bleaching.
- Analysis: Use tracking software (e.g., TrackMate in Fiji, u-Track) to detect EB3-GFP comets. Calculate parameters: growth speed (µm/min), lifetime, catastrophe frequency.
Protocol 2: Spinning Disk Confocal Assay for Cytoplasmic Microtubule Dynamics
Objective: Image the entire microtubule cytoskeleton in live cells to track dynamic instability parameters away from the cortex.
Materials: See "The Scientist's Toolkit" below. Procedure:
- Cell Preparation & Transfection: As in Protocol 1, but transfect with a plasmid encoding GFP-α-Tubulin or mApple-α-Tubulin.
- Media Exchange: As in Protocol 1.
- Microscope Setup:
- Mount dish on a pre-warmed, CO₂-controlled stage.
- Use a 60x or 100x oil-immersion objective (NA ≥1.4).
- Configure the appropriate laser lines (488 nm for GFP, 561 nm for mApple) and emission filters on the spinning disk system.
- Set the camera (sCMOS recommended) and adjust the pinhole size to ~1 Airy Unit.
- Z-stack Acquisition: For a single cell, acquire a z-stack spanning the entire cell volume (e.g., 15 slices at 0.5 µm intervals) every 5-10 seconds for 5-10 minutes.
- Analysis: Use 3D reconstruction and line-scan kymograph analysis (in Fiji) from different cellular regions (perinuclear, mid-cell, cortex). Measure growth and shrinkage rates, transition frequencies, and microtubule curvature/organization in 3D.
Visualization
Title: Microscope Selection Decision Tree
Title: Illumination Depth Defines Sample Reach
The Scientist's Toolkit: Key Research Reagent Solutions
| Item | Function in Experiment | Example/Notes |
|---|---|---|
| High-Precision Coverslips/Dishes (#1.5H) | Optimal thickness (170 µm) for high-NA objectives. Minimal aberrations. | MatTek dishes, CellVis dishes. |
| Live-Cell Imaging Medium (Phenol-red free) | Maintains cell health during imaging. Reduces background fluorescence. | FluoroBrite DMEM, Leibovitz's L-15 medium. |
| EB3-GFP Plasmid | Marker for growing microtubule plus-ends. Essential for +TIP dynamics assays. | Commercially available from addgene (plasmid #39299). |
| GFP-α-Tubulin Plasmid | Labels the entire microtubule polymer. For visualizing network architecture. | Addgene plasmid #56424 (GFP-Tubulin). |
| Fiducial Markers (Tetraspeck beads) | For aligning multi-channel images and TIRF angle calibration. | 0.1µm Tetraspeck beads, Thermo Fisher. |
| Mitochondrial Inhibitor (Oxalic Acid) | Reduces metabolic activity, lowering intracellular motion for sharper images. | Use at low dose (e.g., 1µM). |
| Anti-Fade Reagents (for fixed samples) | Preserves fluorescence signal during fixed-cell imaging. | ProLong Diamond, SlowFade Glass. |
| Microtubule-Targeting Agents (Control) | Positive control for dynamic instability changes. | Nocodazole (depolymerizer), Paclitaxel (stabilizer). |
Application Notes
Within the context of microtubule dynamics assay research, the choice of imaging modality is critical. Total Internal Reflection Fluorescence (TIRF) microscopy and Lattice Light-Sheet (LLS) microscopy represent two powerful but philosophically distinct approaches. The decision pivots on the specific balance between spatial resolution, temporal resolution, and photodamage required for the experimental question.
TIRF Microscopy excels in studying processes at or near the plasma membrane with exceptional signal-to-noise ratio (SNR) and axial resolution. It is the gold standard for in vitro reconstitution assays of microtubule dynamics, single-molecule tracking of microtubule-associated proteins (MAPs), kinesin/dynein motility, and end-binding protein tip tracking. Its limitation is the restricted illumination volume (~100-200 nm deep), which precludes imaging entire cells or 3D cytoskeletal structures without invasive cell flattening.
Lattice Light-Sheet Microscopy illuminates only the focal plane of detection with a thin sheet of light, providing rapid, gentle, 3D imaging. This is transformative for studying microtubule dynamics in their native 3D context within living cells—observing spindle formation, microtubule-organizing center (MTOC) dynamics, and cortical microtubule networks over extended periods with minimal phototoxicity. Its lateral resolution, while excellent, is typically slightly lower than TIRF, and it requires more specialized sample mounting.
| Parameter | TIRF Microscopy | Lattice Light-Sheet Microscopy |
|---|---|---|
| Illumination Volume | Evanescent field (~100-200 nm depth) | Thin light sheet (typically 0.3-5 µm thick) |
| Axial Resolution | ~100 nm | ~300-500 nm (with deconvolution) |
| Lateral Resolution | ~200-250 nm (diffraction-limited) | ~200-300 nm (diffraction-limited) |
| Typical Frame Rate (Full FOV) | 10-100 Hz (2D) | 1-10 Hz (3D stack, depending on volume) |
| Photobleaching/Photodamage | High (intense illumination in thin zone) | Very Low (illumination confined to detected plane) |
| Sample Compatibility | Adherent cells, single molecules, in vitro assays | Cells, embryos, small organoids, more sensitive to mounting geometry |
| Key Application in Microtubule Research | Single-molecule kinetics, sub-resolution tip tracking, in vitro motility assays | Long-term 4D microtubule network dynamics, mitotic spindle assembly, 3D intracellular transport |
Experimental Protocols
Protocol 1: TIRF Microscopy forIn VitroMicrotubule Dynamics Assay
Objective: To visualize the polymerization dynamics of stabilized microtubule seeds and dynamic tubulin using recombinant end-binding proteins (EB3-mNeonGreen).
- Flow Chamber Preparation: Clean a glass coverslip (#1.5H) and functionalize with Poly-L-Lysine-PEG-biotin. Assemble a flow chamber using double-sided tape and a top coverslip with drilled ports.
- Surface Passivation & Seed Immobilization: Sequentially flow in: i) 0.2 mg/mL PLL-PEG (5 min), ii) 0.5 mg/mL Neutralavidin (5 min), iii) Biotinylated, GMPCPP-stabilized microtubule seeds (diluted in BRB80 buffer, 5 min).
- Assay Assembly: Prepare imaging mix in BRB80: 10-12 µM tubulin (15% Alexa Fluor 647-labeled), 50 mM KCl, 1 mM GTP, 1 mM DTT, 0.2 mg/mL κ-casein, 0.1% methylcellulose (4000 cP), and 20-50 nM EB3-mNeonGreen.
- Imaging: Flow in the imaging mix. Mount chamber on a TIRF microscope equipped with 488 nm and 640 nm lasers, a 100x/1.49 NA oil TIRF objective, and an EMCCD or sCMOS camera. Adjust the TIRF angle to achieve a ~150 nm evanescent field. Acquire dual-color time-lapse images at 1-2 second intervals for 10-15 minutes.
Protocol 2: Lattice Light-Sheet Imaging of Microtubule Dynamics in Live Cells
Objective: To capture 3D microtubule dynamics in a living RPE-1 cell stably expressing EB3-tdTomato over 1 hour.
- Cell Preparation: Seed cells into custom LLSM-compatible fluoropolymer-coated coverslips or 5 mm glass capillaries 24-48 hours prior. Transfer to phenol-red-free imaging medium.
- Sample Mounting: For a coverslip, mount in the LLSM sample chamber filled with imaging medium. For a capillary, carefully aspirate the cell-containing capillary and mount it in the capillary rotator/holder.
- System Alignment: Align excitation lattice and detection light paths using sub-100 nm beads. Ensure the thin light sheet (e.g., 1.5 µm thickness) is co-planar with the detection focal plane of the detection objective (e.g., 40x/1.1 NA water immersion).
- Acquisition Parameters: Set imaging volume to encompass the entire cell cytoplasm and nucleus (e.g., 50 x 30 x 20 µm). Use 560 nm laser for excitation. Set exposure time to 10-20 ms per plane. Acquire a z-stack (0.3 µm steps) every 3-5 seconds. Use adaptive or constant speed stage scanning.
Visualization
Diagram Title: Microscope Selection Workflow for Microtubule Assays
Diagram Title: TIRF Microscope Optical Configuration
The Scientist's Toolkit: Research Reagent Solutions
| Reagent/Material | Function in Microtubule Dynamics Assay |
|---|---|
| #1.5H High-Precision Coverslips | Optimal thickness (170 µm) for high-NA objectives. Essential for TIRF quality. |
| Poly-L-Lysine-PEG-Biotin | Passivates glass surface to prevent non-specific binding and provides biotin handles for seed immobilization (TIRF). |
| GMPCPP (Guanylyl-(α,β)-methylene-diphosphonate) | Non-hydrolyzable GTP analog used to prepare stable, biotinylated microtubule "seeds" for dynamics assays. |
| Methylcellulose (4000 cP) | Viscosity agent added to in vitro assays to suppress microtubule diffusion and curl, facilitating 2D imaging. |
| HaloTag/SNAP-tag Ligands (Janelia Fluor dyes) | Bright, cell-permeable dyes for specific, high-SNR labeling of recombinant MAPs in both TIRF and LLSM. |
| Fluoropolymer-coated Coverslips | Low-autofluorescence, refractive-index-matched substrates essential for LLSM sample mounting and imaging. |
| SiR-Tubulin / LiveAct (SiR-Actin) | Far-red, cell-permeable fluorogenic dyes for long-term, low-phototoxicity labeling of microtubules/actin in live cells (ideal for LLSM). |
| CO2-Independent Imaging Medium | Maintains pH during long LLSM acquisitions outside a standard incubator. |
This work is part of a broader thesis investigating the use of Total Internal Reflection Fluorescence (TIRF) microscopy as a primary tool for quantifying microtubule dynamics. The core thesis posits that in vitro reconstitution assays monitored by TIRF provide superior mechanistic resolution for classifying and characterizing Microtubule-Targeting Agents (MTAs) compared to conventional cell-based screens. This application note details the protocols derived from this research for direct implementation in drug discovery pipelines.
Core Principles: TIRF Microscopy for Microtubule Dynamics
TIRF microscopy creates an evanescent field that excites fluorophores within approximately 100 nm of the coverslip-liquid interface. This optical sectioning is ideal for imaging single microtubules adhered to a passivated glass surface, eliminating background fluorescence from free tubulin in solution. The assay typically measures:
- Microtubule Growth Rate: Polymerization from stabilized seeds.
- Catastrophe Frequency: Transition from growth to shrinkage.
- Rescue Frequency: Transition from shrinkage to growth.
- Tubulin Off-rate: Determined by fluorescence intensity changes.
Key Experimental Protocols
Protocol: Preparation of Biotinylated and GMPCPP-Stabilized Microtubule Seeds
Objective: Generate short, stable microtubule seeds to initiate dynamic growth for assays. Reagents: Tubulin (e.g., porcine brain, >99% pure), Biotinylated tubulin (5-20% molar ratio), GMPCPP (non-hydrolyzable GTP analog), BRB80 buffer (80 mM PIPES, 1 mM MgCl₂, 1 mM EGTA, pH 6.8 with KOH). Procedure:
- Mix: Combine unlabeled tubulin and biotinylated tubulin (typically at a 19:1 molar ratio) in BRB80 to a final concentration of 5-10 µM.
- Initiate Polymerization: Add GMPCPP to a final concentration of 1 mM.
- Incubate: Incubate the mixture at 37°C for 60 minutes.
- Stabilize & Pellet: Add 20 µM paclitaxel (Taxol) and incubate for an additional 10 minutes. Pellet seeds at 100,000 x g for 10 minutes at 25°C.
- Resuspend: Gently resuspend the pellet in BRB80 with 1 mM GMPCPP and 10 µM paclitaxel. Store at room temperature for up to 2 weeks.
Protocol: Flow Chamber Assembly and Surface Passivation
Objective: Create a functionalized imaging chamber for microtubule attachment. Procedure:
- Construct Chamber: Affix a glass coverslip (#1.5) to a microscope slide using double-sided tape to create a flow channel.
- Biotin-BSA Coating: Flow in 0.5 mg/mL Biotin-BSA in BRB80. Incubate for 5 minutes.
- Block: Flow in 1% Pluronic F-127 in BRB80. Incubate for 10 minutes to block non-specific binding.
- NeutrAvidin Coating: Flow in 0.1 mg/mL NeutrAvidin in BRB80. Incubate for 5 minutes.
- Seed Attachment: Dilute GMPCPP-stabilized biotinylated seeds in BRB80 and flow into the chamber. Allow to bind for 5 minutes.
- Wash: Gently wash with BRB80 to remove unbound seeds.
Protocol: TIRF-based Dynamic Microtubule Assay with MTA Screening
Objective: Measure the effect of a compound on microtubule dynamic instability parameters. Reagents: Tubulin (30-50% labeled with a fluorophore, e.g., Alexa Fluor 647), MTA (test compound), BRB80, Oxygen Scavenging System (OSS: 50 mM glucose, 400 µg/mL glucose oxidase, 80 µg/mL catalase, 10 mM DTT). Procedure:
- Prepare Reaction Mix: In BRB80, combine:
- 10-15 µM tubulin (mixed labeled/unlabeled).
- 1 mM GTP.
- OSS components.
- Test compound (at desired concentration) or vehicle control (DMSO).
- Initiate Assay: Flow the reaction mix into the prepared chamber containing surface-bound seeds.
- Image Acquisition: Immediately transfer to a TIRF microscope. Acquire time-lapse images (typically 1 frame/3-5 seconds) for 20-30 minutes using a 640 nm laser for excitation and a suitable emission filter.
- Data Extraction: Use automated tracking software (e.g., KymographClear, FIESTA, or uTrack) to generate kymographs and extract parameters: growth/shrinkage rates, catastrophe/rescue frequencies, and microtubule lifetime.
Data Presentation: Quantitative Analysis of Representative MTAs
Table 1: Effects of Characterized MTAs on Microtubule Dynamics Parameters in TIRF Assay Data are representative values derived from published TIRF studies. IC₅₀ values are compound concentrations that reduce the growth rate by 50%.
| Compound Class | Example | Primary Effect | Growth Rate (µm/min) | Catastrophe Freq. (min⁻¹) | Rescue Freq. (min⁻¹) | Apparent IC₅₀ (TIRF Assay) |
|---|---|---|---|---|---|---|
| Stabilizer | Paclitaxel (Taxol) | Suppresses dynamics | 0.8 ± 0.3 (from 1.5 ± 0.4 in control) | 0.02 ± 0.01 (from 0.05 ± 0.02) | 0.15 ± 0.05 (from 0.10 ± 0.03) | ~10 nM |
| Destabilizer | Vinblastine | Induces depolymerization | 0.2 ± 0.1 | 0.20 ± 0.05 | 0.01 ± 0.01 | ~100 nM |
| Growth Inhibitor | Peloruside A | Suppresses growth | 0.5 ± 0.2 | 0.03 ± 0.01 | 0.08 ± 0.03 | ~50 nM |
| Catastrophe Promoter | S-Trityl-L-Cysteine (STLC) | Increases catastrophes | 1.2 ± 0.3 | 0.15 ± 0.04 | 0.04 ± 0.02 | ~500 nM |
| Control (DMSO) | Vehicle | Baseline dynamics | 1.5 ± 0.4 | 0.05 ± 0.02 | 0.10 ± 0.03 | N/A |
Table 2: Key Research Reagent Solutions for TIRF Microtubule Assay
| Reagent/Chemical | Function in Assay | Typical Supplier/Example |
|---|---|---|
| Tubulin, >99% Pure | Core protein component for microtubule polymerization. | Cytoskeleton Inc. (Cat #T240) or in-house purification. |
| Biotinylated Tubulin | Allows specific attachment of microtubule seeds to NeutrAvidin-coated surface. | Cytoskeleton Inc. (Cat #BT239) |
| GMPCPP | Non-hydrolyzable GTP analog used to polymerize stable microtubule seeds. | Jena Bioscience (Cat #NU-405) |
| Pluronic F-127 | Non-ionic surfactant used to passivate glass surfaces, preventing non-specific protein adsorption. | Sigma-Aldrich (Cat #P2443) |
| NeutrAvidin | Tetrameric protein that binds biotin with high affinity, used to bridge biotinylated seeds to the surface. | Thermo Fisher (Cat #31000) |
| Oxygen Scavenging System (Glucose Oxidase/Catalase) | Reduces photobleaching and oxidative damage during prolonged TIRF imaging. | Sigma-Aldrich (Cat #G2133 & #C40) |
| Anti-Bleaching Agents (e.g., Trolox) | Further stabilizes fluorophores to extend imaging time. | Sigma-Aldrich (Cat #238813) |
Visualization of Workflows and Pathways
TIRF-Based MTA Screening Workflow
MTA Effects on Microtubule Dynamics
Conclusion
TIRF microscopy stands as an indispensable, high-precision tool for dissecting the nanoscale dynamics of microtubules at the cell cortex. By mastering its foundational principles, implementing robust methodological protocols, and applying systematic troubleshooting, researchers can generate quantitative, high-fidelity data on microtubule behavior. This capability is paramount not only for advancing fundamental cell biology but also for propelling drug discovery efforts. Validated TIRF-based assays provide a direct, visual readout of how potential therapeutics, such as novel MTAs, alter microtubule dynamics, offering a powerful platform for mechanistic studies and high-content screening. Future directions will likely integrate TIRF with super-resolution techniques, advanced computational tracking, and AI-driven analysis to further unravel the complexity of the cytoskeleton in health and disease, solidifying its role as a cornerstone technology in biomedical research.