Beyond the Petri Dish: How 3D Cell Cities and AI are Revolutionizing Medicine
Imagine if the future of medicine wasn't tested on people, or even animals, but on perfect, living replicas of human organs, smaller than a pea.
Why Flat Biology Isn't Enough
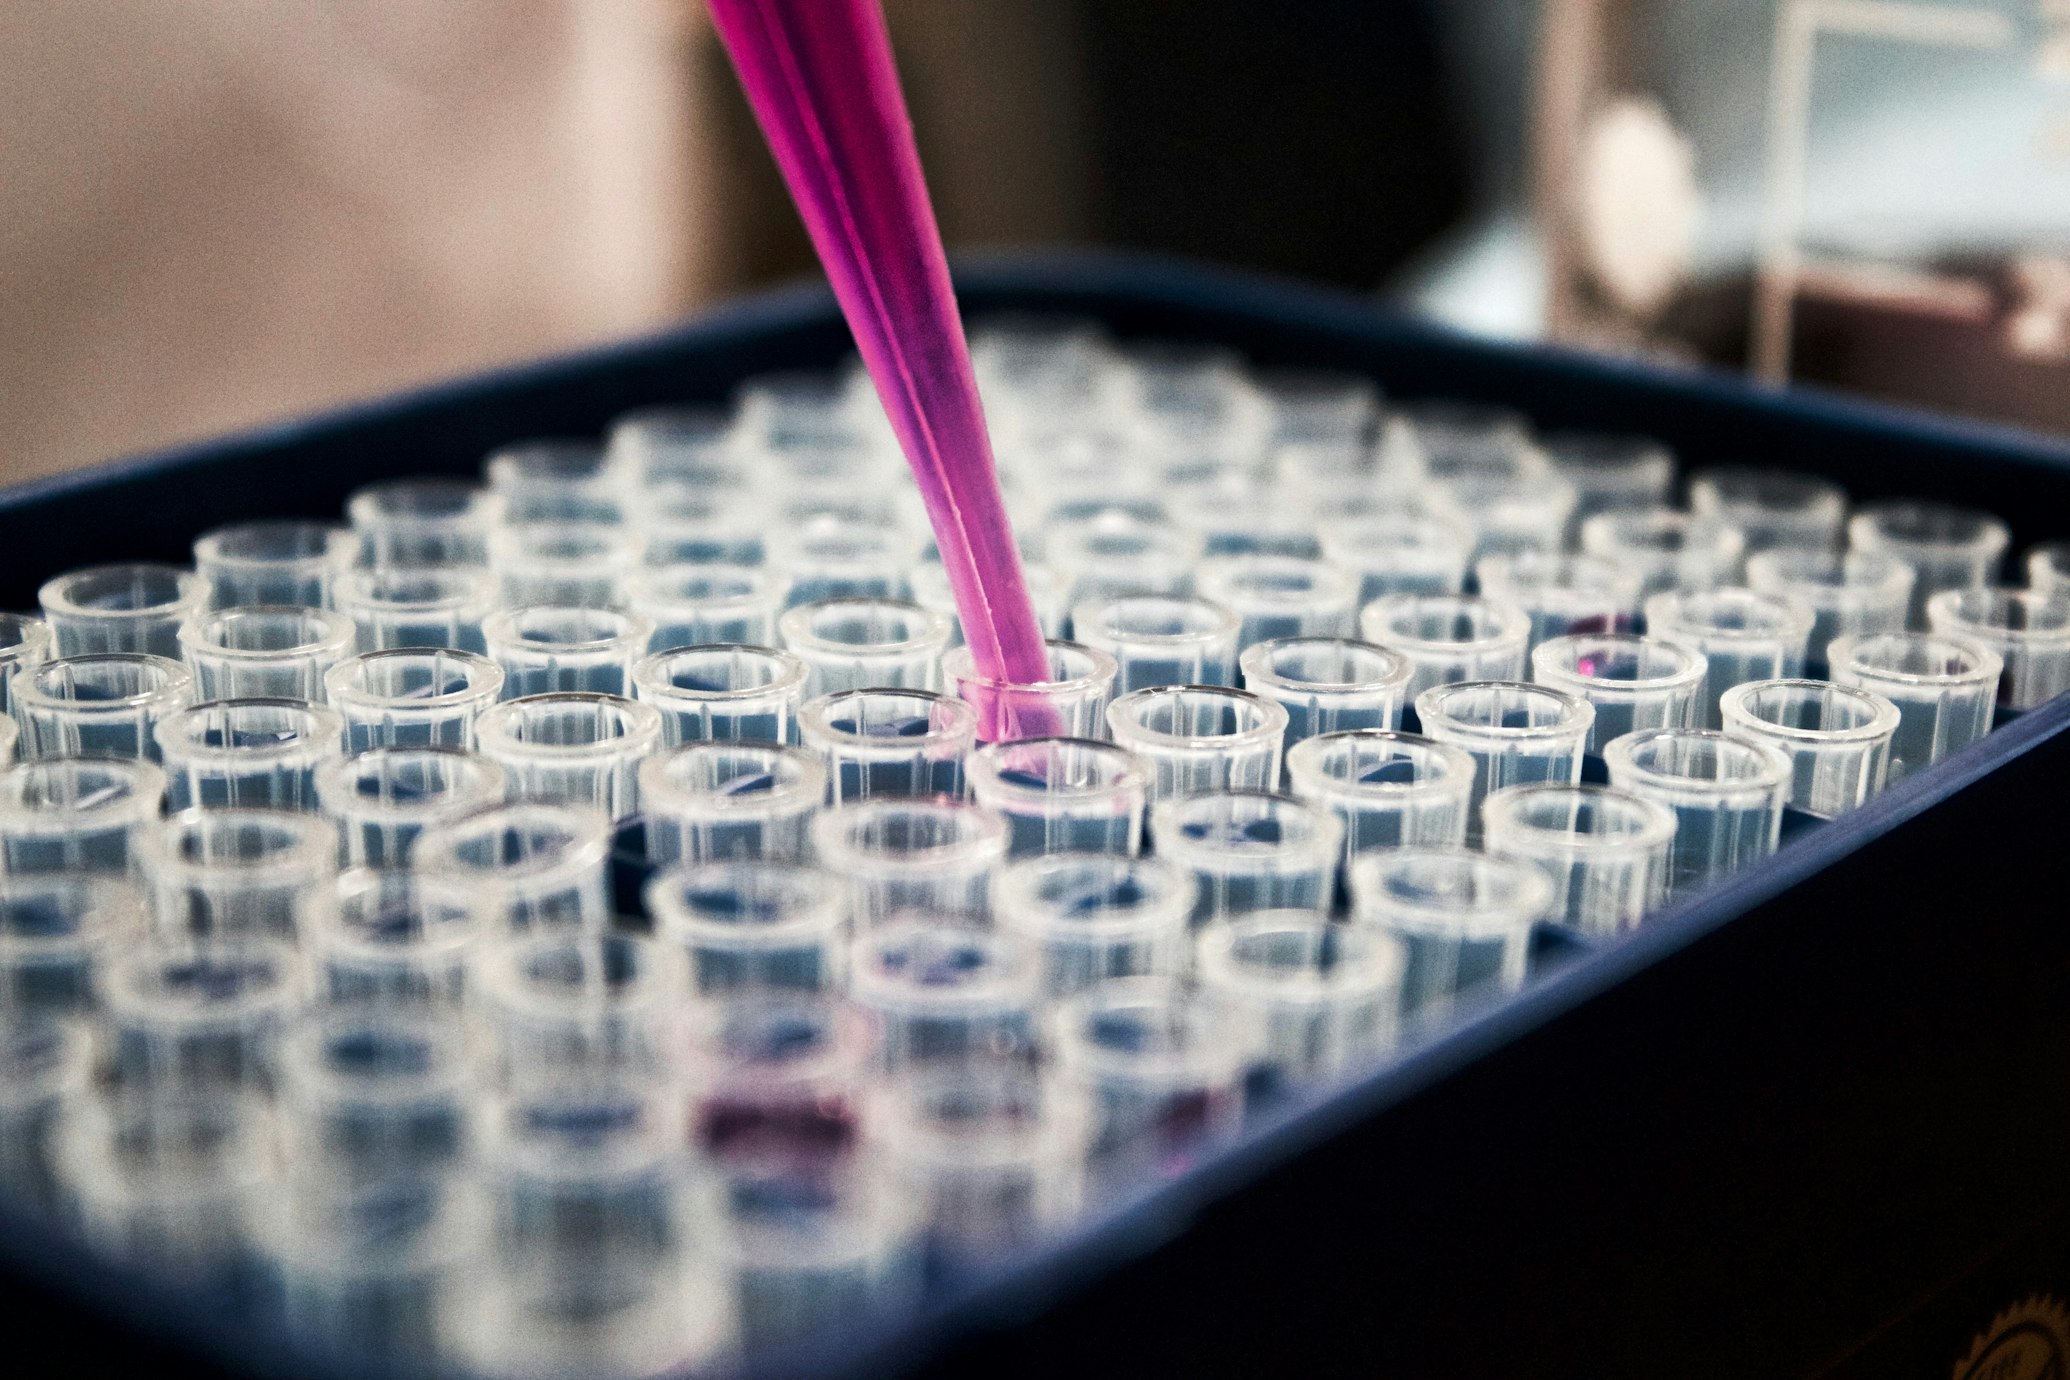
For over a century, biologists have grown cells in Petri dishes. These are 2D cultures—think of them as a single layer of cells spread on a flat surface, like a pancake. While useful, they have a huge limitation: our bodies aren't 2D. Cells in your liver, brain, or a tumor grow in complex, three-dimensional structures, communicating with their neighbors in all directions. A 2D pancake of cells can't replicate this intricate environment, which is why so many drugs that work in a dish fail in human trials .
2D Cell Cultures
Flat, single-layer cell growth that doesn't accurately represent human tissue complexity.
Biological Relevance: 30%3D Organotypic Cultures
Complex, three-dimensional structures that better mimic human organ architecture and function.
Biological Relevance: 85%Enter 3D Organotypic Cultures. These are often called "organoids" or "mini-organs." Scientists can now coax stem cells to self-organize into 3D structures that remarkably resemble real human organs, complete with different cell types and complex architectures . They are the "living LEGOs" of biology, offering a more truthful model for studying human development, disease, and drug responses.
What is Phenotype? Seeing is Measuring
In biology, "genotype" is the blueprint—your DNA sequence. "Phenotype" is the physical expression of that blueprint—the cell's shape, size, structure, and behavior. It's the difference between a neuron's long branches and a round, blood-carrying red blood cell; both have the same DNA, but their phenotypes are wildly different.
Quantitative Phenotypic Analysis is the process of measuring these physical traits in a precise, numerical way. When you combine this with high-tech 3D microscopes that can take images through entire organoids (like a mini-MRI scan), you get a massive amount of data. Sophisticated computer algorithms (a form of AI) then analyze these images to extract hundreds of measurements, turning what we see into hard numbers we can statistically analyze .
Genotype
The genetic blueprint encoded in DNA sequences.
Phenotype
The observable characteristics resulting from genotype and environment.
Quantitative Analysis
Measuring phenotypic traits with numerical precision for statistical analysis.
A Key Experiment: Testing a New Cancer Drug in Mini-Tumors
Let's dive into a specific, crucial experiment that showcases this technology's power.
The Goal
To determine if a new experimental drug, "TheraBloc-A," can effectively shrink and disrupt the growth of patient-derived cancer organoids (mini-tumors grown in the lab from a patient's own cancer cells).
The Methodology, Step-by-Step
Organoid Generation
Cancer cells are taken from a patient's biopsy and embedded in a nurturing, jelly-like substance called Matrigel, which provides a 3D scaffold for them to grow.
Drug Treatment
The mini-tumors are divided into four groups: Control (no drug), Low dose, Medium dose, and High dose of TheraBloc-A. The treatment lasts for one week.
Staining and Imaging
The organoids are stained with fluorescent dyes that highlight: Blue (DAPI) All cell nuclei Green (Ki-67) Proliferating cells Red (Cleaved Caspase-3) Dying cells
Image Acquisition
A high-resolution confocal microscope is used to take 3D images of dozens of organoids from each group, creating a stack of images from the bottom to the top of each mini-tumor.
Quantitative Analysis
AI-powered software analyzes every single 3D image. It automatically identifies each organoid and measures key phenotypic features.

- Control No drug
- Low Dose TheraBloc-A
- Medium Dose TheraBloc-A
- High Dose TheraBloc-A
Results and Analysis
The computer's analysis revealed dramatic, dose-dependent changes.
Organoid Size
The high-dose organoids were significantly smaller than the control group, indicating the drug successfully inhibited growth.
Proliferation
The number of green (Ki-67 positive) cells plummeted in the treated groups, showing the drug stopped cancer cells from dividing.
Cell Death
The number of red (Cleaved Caspase-3 positive) cells skyrocketed, proving the drug was actively killing the cancer cells.
The Data: Putting a Number on Change
This table shows the average measurements per organoid across the different treatment groups.
| Treatment Group | Average Organoid Volume (µm³) | % of Proliferating (Ki-67+) Cells | % of Dying (Caspase-3+) Cells |
|---|---|---|---|
| Control | 1,250,000 | 45% | 3% |
| Low Dose | 980,000 | 32% | 8% |
| Medium Dose | 550,000 | 18% | 22% |
| High Dose | 300,000 | 5% | 45% |
The drug also altered the very structure of the organoids, making them less complex.
| Treatment Group | Sphericity (0-1, where 1 is a perfect sphere) | Surface Roughness Index |
|---|---|---|
| Control | 0.85 | 1.45 |
| Low Dose | 0.88 | 1.30 |
| Medium Dose | 0.92 | 1.15 |
| High Dose | 0.95 | 1.05 |
A look at the essential tools used in this experiment.
| Tool / Reagent | Function in the Experiment |
|---|---|
| Matrigel | A gelatinous protein mixture that acts as a 3D scaffold, mimicking the extracellular environment of human tissues. |
| Confocal Microscope | A high-powered microscope that uses lasers to take sharp, clear images at different depths within a 3D sample. |
| Fluorescent Antibodies | Molecular tags that bind to specific targets (like Ki-67) and glow, allowing scientists to "see" specific processes. |
| Image Analysis Software | The AI "brain" that automatically identifies objects in images and extracts hundreds of quantitative measurements. |
| Patient-Derived Cells | The living raw material, taken directly from a patient, ensuring the model is biologically relevant. |
Conclusion: A Clearer Path to Personalized Medicine
The marriage of 3D organotypic cultures and quantitative image analysis is more than just a technical advance; it's a fundamental shift in how we understand biology and disease. It allows us to move from observing to measuring, from guessing to knowing.
This technology is already paving the way for personalized medicine. Imagine a future where, upon a cancer diagnosis, a doctor could quickly grow a mini-version of your tumor, test a panel of drugs on it, and use quantitative analysis to identify the most effective treatment for you—all before you ever take a single pill . By decoding the language of phenotypes in these miniature organ cities, we are building a faster, smarter, and more humane future for medicine.
Quantitative phenotypic analysis of 3D organotypic cultures represents a paradigm shift in biomedical research, bridging the gap between traditional 2D cell cultures and complex in vivo systems.
- Personalized drug testing
- Reduced animal testing
- Higher drug success rates
- Faster treatment development
3D Models
Organotypic cultures provide more biologically relevant models than traditional 2D cultures.
Quantitative Analysis
AI-powered image analysis transforms visual observations into measurable data.
Personalized Medicine
Patient-derived organoids enable tailored treatment strategies.